On April 2, 2020 an article I wrote, titled "Is it Time To Look At Corn Futures and Related ETFs?", was posted on StockCharts.com. Please refer to that article for a full view of this update.
Note: None of the markets, ETFs or stocks listed in this article are recommendations to buy or sell; this article is intended for educational purposes only.
Using pattern recognition often requires patience, following the pattern and analyzing price behavior. It's been 2 weeks since the original article was published, and the corn futures are now very close to the lower end of the range outlined in the first article.
As an update to that, we'll look at the 60-minute chart and update the analysis with the current pattern.
Chart 1 below is the same chart that was posted on April 2, 2020. The price pattern label has been updated, an adjustment to the 1.27 extension is highlighted with the yellow circle and 2 lines that illustrated areas to watch in the event price moved lower, which it has, have been removed to unclutter the chart. (You will see them if you refer to the original article.)
The adjustment to the 1.27 is worth noting, as this is something that can occur from time to time using software that will draw these extensions or any Fibonacci retracements.
The length of the X to A in the original chart was off a little in price; this is because the drawing tool did not exactly catch a high or low. So the lesson is similar to measure twice, cut once. The re-adjustment shows price finding some support at the 1.27 having a small rally (light blue line), then forming a sideways range before continuing lower. There were bullish divergences on the RSI and MACD with this rally that occurred just a couple of days after the original article.
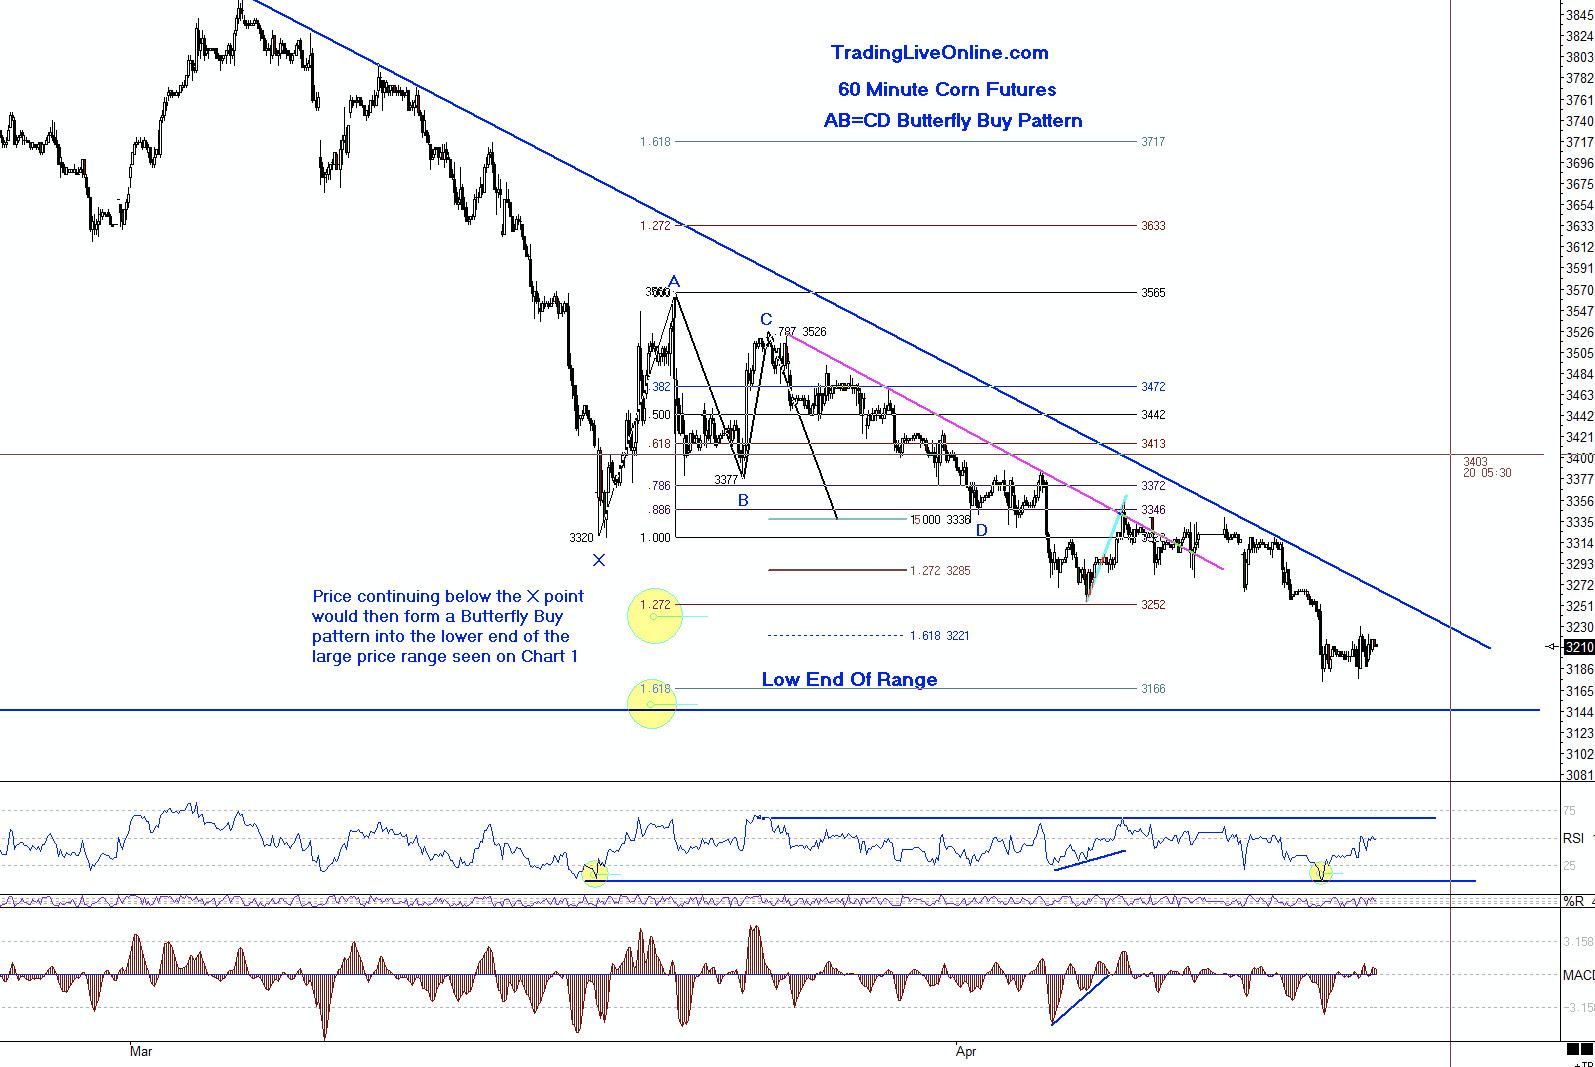
Chart 1 - Corn Futures 60-minute chart
Notice the two trend lines, one in pink and the other blue. On the small rally, the price hovered only a little above, never breaking strongly to the upside; it found strong resistance at the upper blue trend line. This can certainly be a clue the market may move down towards the lower end of range, as discussed in the original article, and towards the 1.618 extension area.
We want to have patience and see if price holds that lower end of the price level range and for signs of a move up.
I have used horizontal lines to mark in the range of the RSI. There are 2 yellow circles and the far right is a slightly higher RSI. A better divergence would now be a lower price and higher RSI, with price holding above the lower end of the range.
A break of the blue trend line could also be a signal. As mentioned earlier, patience is certainly needed with this pattern; however, the trend line is very clear at this time and a strong break above may lead to a larger retracement move to the upside.
It's always important to learn entry skills, which include combining elements of intraday time frames, momentum indicators and other price patterns to control risk and also, at times waiting on the sideline until there is confirmation.
There are trading techniques that can be learned and implemented to control risk and monitor the price behavior. We never know what price will do; the only element we can control is the risk.
If you would like to learn more about these patterns and programs to learn to trade them, please visit me at my website TradingLiveOnline.com, or feel free to email me at ljouflas@msn.com.
Best wishes for successful trading!
Leslie Jouflas, CMT