Crude Oil has had a spectacular move to the downside. Looking back decades to 1986 on a price chart, we have a fascinating study of where the important levels of support and resistance have been formed. The fact that price levels have memory can be one of the best tools for traders.
Let's start by walking through Chart 1 and see where price is currently. Then, we will study how this level (and potentially a lower level) may prove to be very important and possibly offer opportunities for traders.
Note - None of the markets, ETFs or stocks listed in this article are recommendations to buy or sell. This article is intended for educational purposes only.
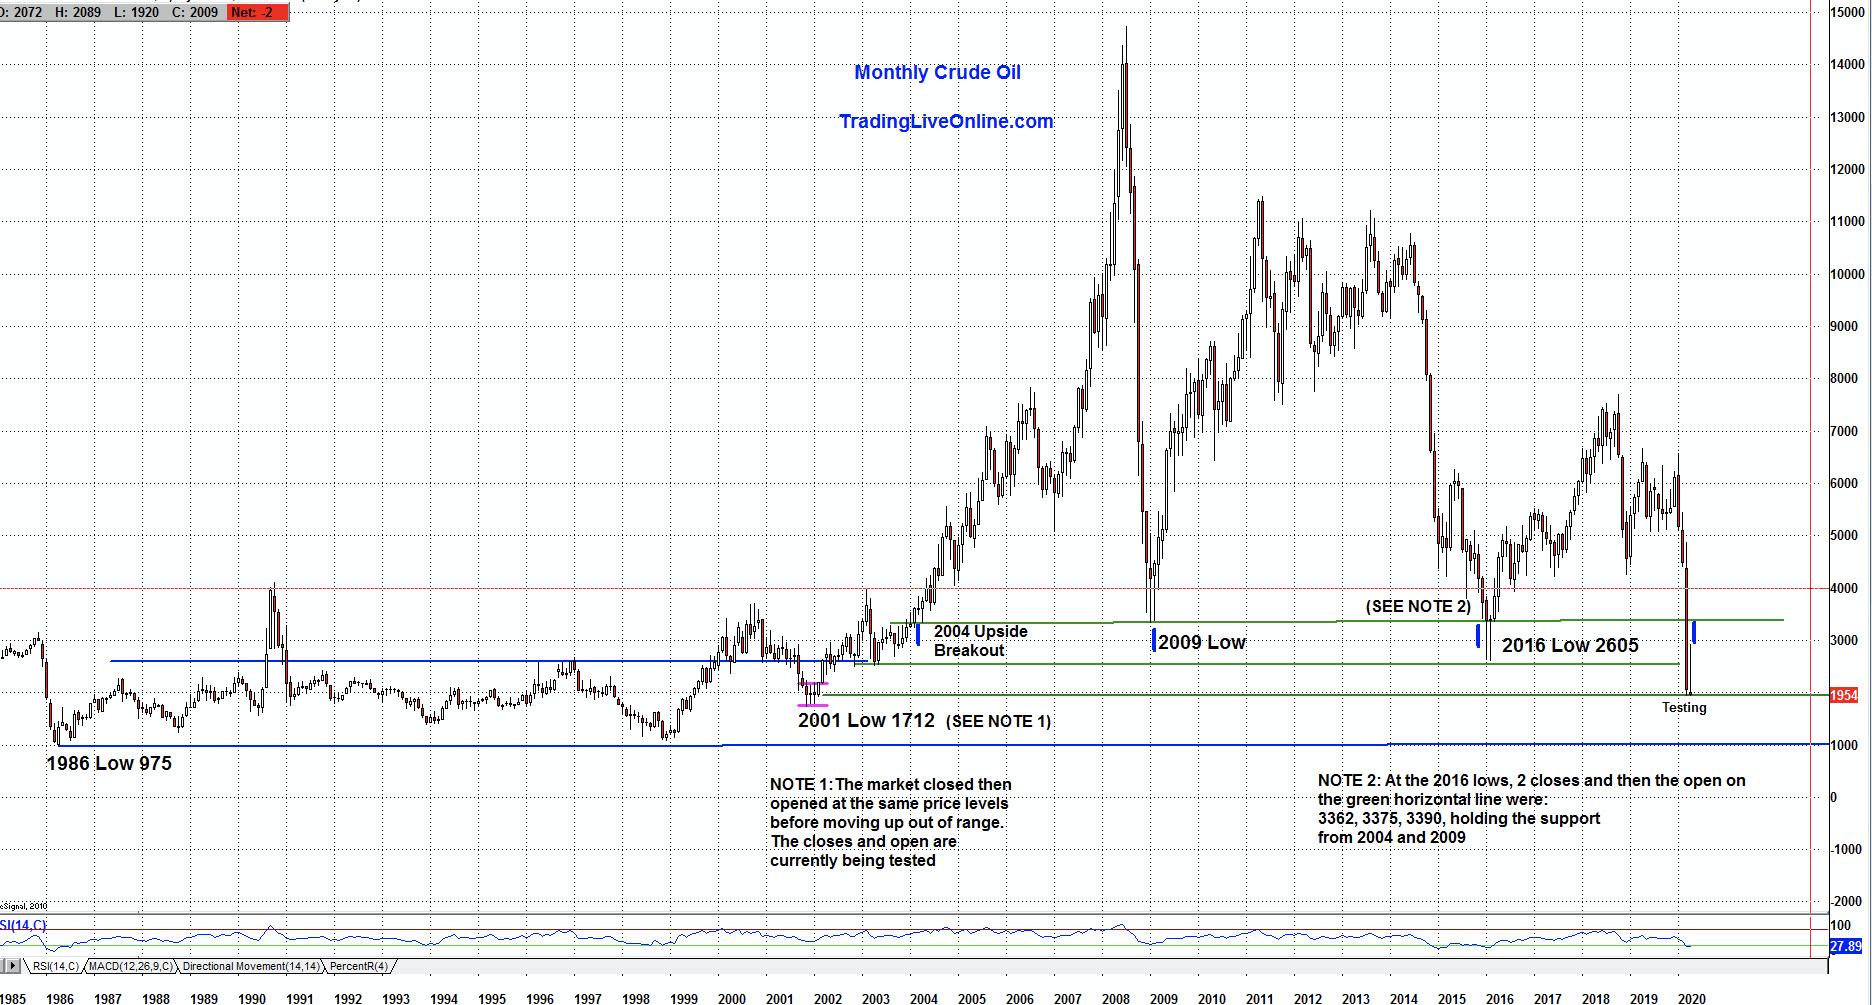
Chart 1 - Monthly Crude Oil Continuous Contract
As of today (April 15, 2020), price is testing the 2001 opening and closing prices in the range that was formed over 2001-2002 before a massive move to the upside. You can see that range in Chart 1, outlined between the pink horizontal lines. The low of that range was 17.12, but what is most interesting is the price levels around the closing prices and opening prices in that range. The price range centered around 19.40 level, which indicates a period of indecision and forms a coil that will eventually resolve with a move away from the center of the price area.
Fast forward 19 years and price is close to that price level. This should be an area price finds some support, at least short-term, and has tests, which means some swings in both directions are likely.
If crude oil can rally from these levels, the 2016 lows, along with the first test down after the upside breakout from the 2001/2002 range, would be the first areas to watch.
On the far left side of the chart, you will notice the 1986 lows of 9.75 and several tests of that area over many years. If crude oil does fall further, there is potential support in that area.
Chart 2 shows two Fibonacci extensions of 1.27 into the lower price area of that large range. The extensions are simply calculated by taking the length of X to A, multiplying by 1.27 and subtracting that figure from the A point.
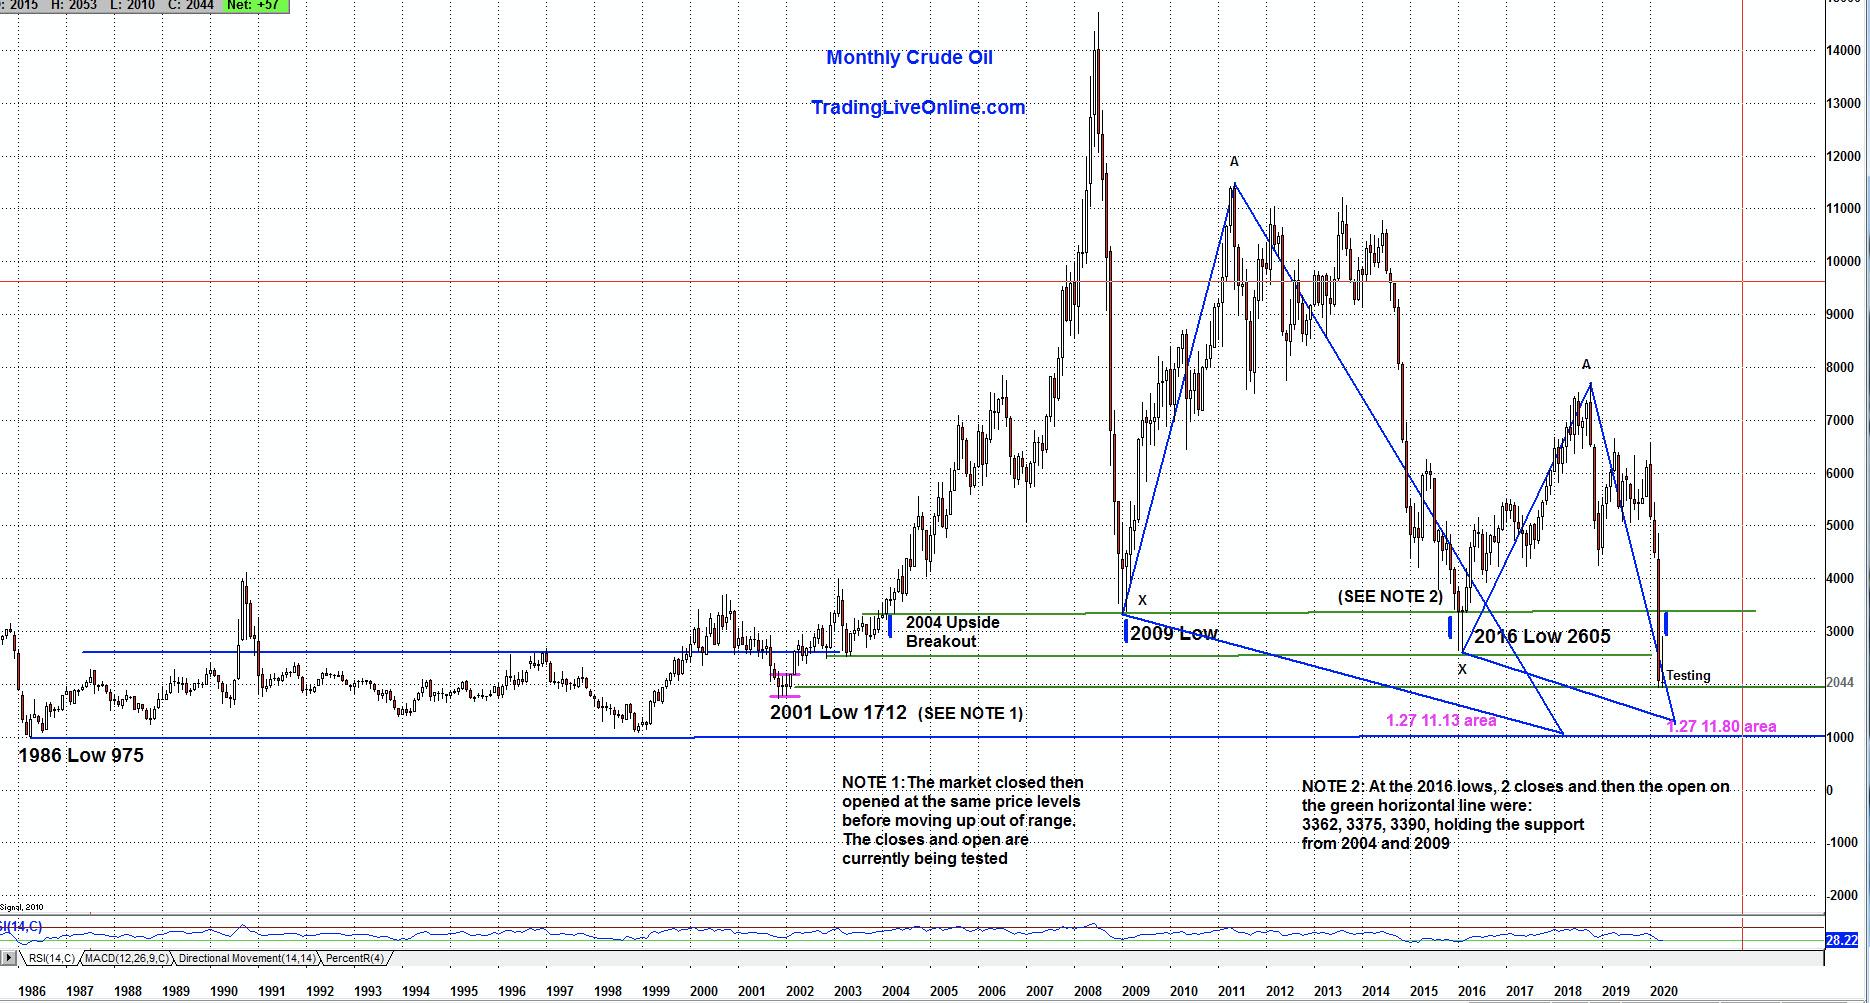
Chart 2 - Fibonacci 1.27 Extensions
Chart 3 below is scaling down to a lower 60-minute timeframe and is starting to show bullish divergences on the MACD, as marked on the chart.
The RSI range is marked in purple horizontal lines and does not yet show a bullish divergence. However, if price were to move up from this level and break the upside of that range with price moving up, that could be a bullish signal.
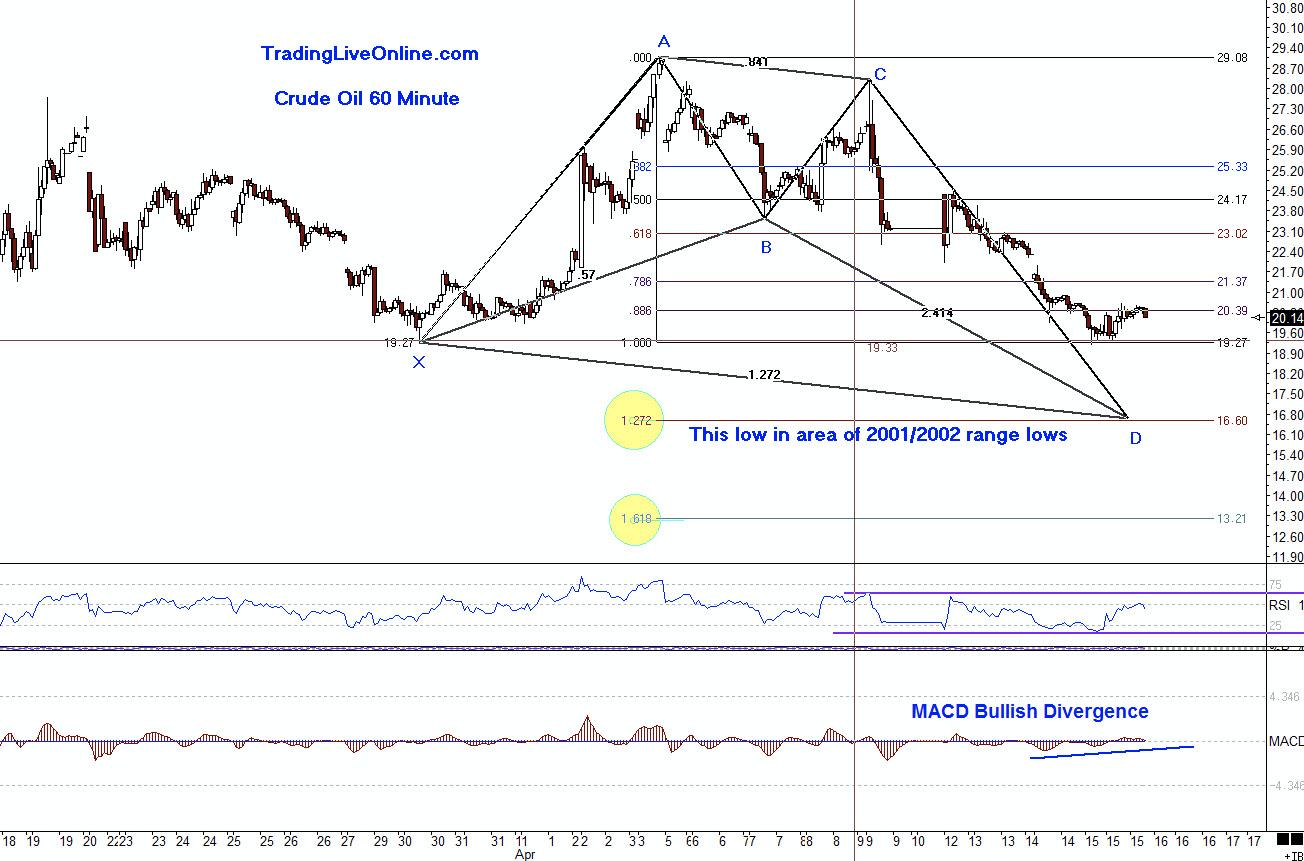
Chart 3 - Potential Butterfly Buy Pattern 60 Minute
I like to look at different scenarios; another one I would monitor is a potential Butterfly Buy pattern if price moved lower from here. The completion area of this pattern, marked in the yellow circle, would be a test back into the lows of the range from 2001/2002, as mentioned earlier in this article. We could then monitor the MACD and RSI for bullish divergences.
Crude oil should be a very interesting market to keep an eye on in the coming days and weeks.
When trading longer-term charts, such as a daily versus intraday, it is very important to learn entry skills, which include combining elements of intraday timeframes, momentum indicators and other price patterns to control risk and also, at times, waiting on the sideline until there is confirmation.
There are entry techniques that can be learned and implemented to control risk and monitor the price behavior. We never know what price will do and the only element we can control is the risk.
If you would like to learn more about these patterns and programs to learn to trade them, please visit me at my website www.tradingliveonline.com or feel free to email me at ljouflas@msn.com.
Best wishes for successful trading!
Leslie Jouflas, CMT
For more information on these patterns, please refer to the book Trade What You See, How to Profit from Pattern Recognition, 2007 Wiley, by Larry Pesavento and Leslie Jouflas.