
SPX Monitoring purposes: Sold SPX on 3/26/20 at 2630.07= gain 17.55%; Long SPX on 3/23/20 at 2237.40
Monitoring purposes GOLD: Long GDX on 4/9/20 at 28.96.
Long Term Trend SPX monitor purposes: Flat
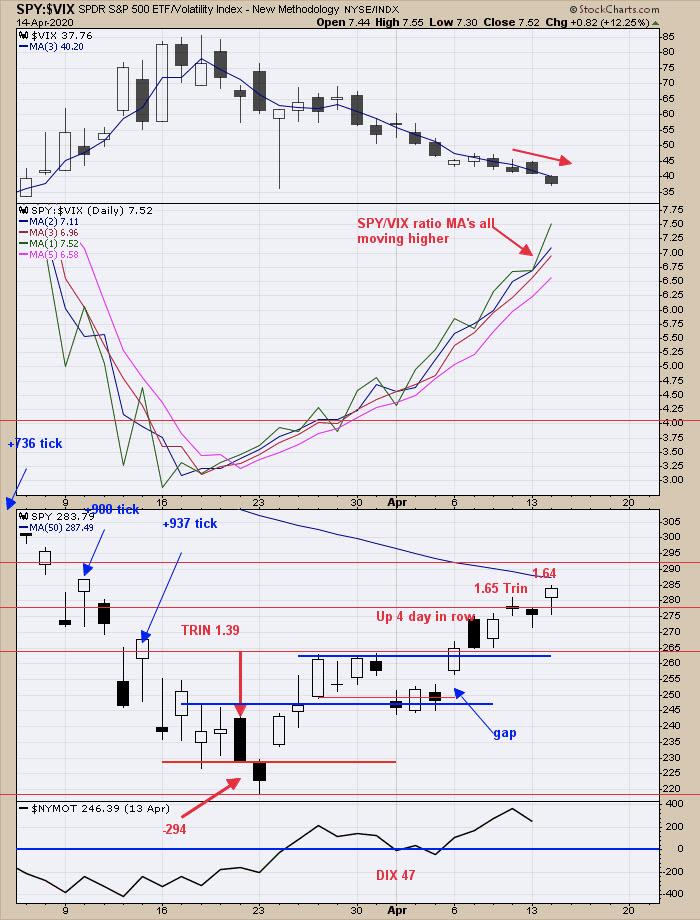
On Friday, the TRIN closed at 1.65; today, it closed at 1.64. Both closed on an up day, which is rare and a condition that can be found at short-term highs. We said yesterday, "The market was up four days in a row going into Friday and has a probability of being higher 73% in five days suggesting Friday high could be tested." Friday's high was tested today and fulfilled that prediction. The SPY/VIX ratio so far is heading higher, suggesting the short term trend is still up. Volume did drop some today, showing upside momentum is weakening. Don't see a safe trade yet. Staying neutral for now. Sold SPX 3/26/20 for gain of 17.55%.
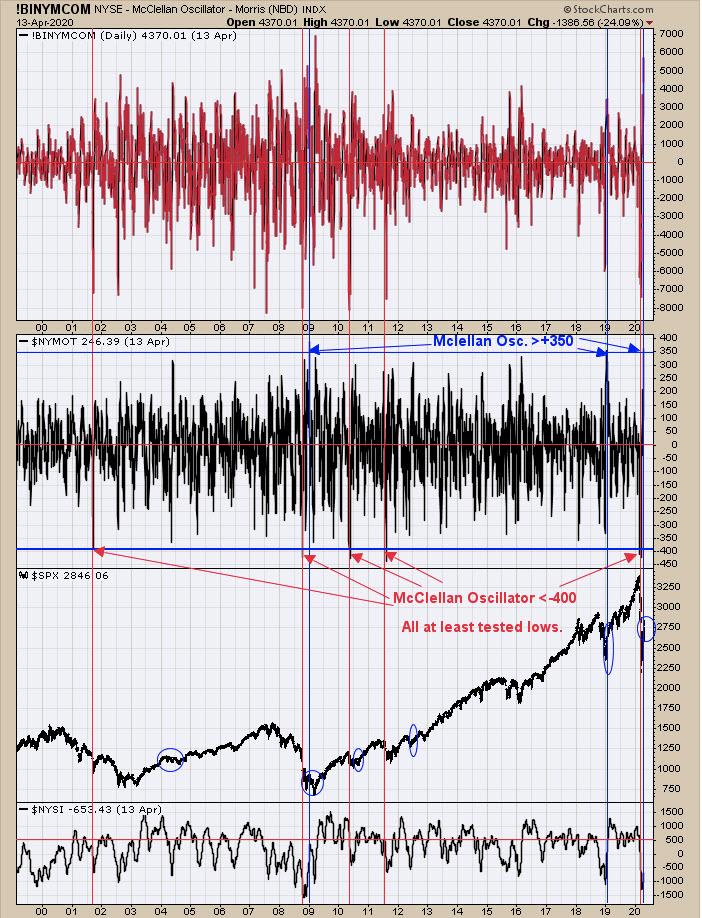
Going back to 1980, the Oscillator reached -400 four times - 2008, 2010, 2011 and 2020. All four came in near major lows and all tested their lows at some point. Last Thursday, the Oscillator closed at +395.33. There were only two other times the McClellan Oscillator reached above +350, those being the rally off the January 2019 low and the early 2009 rally. The early 2009 rally did go back and break to a new minor low, while the rally off the January 2019 rally just kept going. There are a lot of similarities between now and 2008 (VIX both now and 2008 reached +80) and the odds point to a test of the 2008 lows. Also worth noting is that, in all bottoms both minor and major, the 10 day TRIN reached above 1.50. At the March lows, 10 day TRIN stood at .9; the current reading is .98.
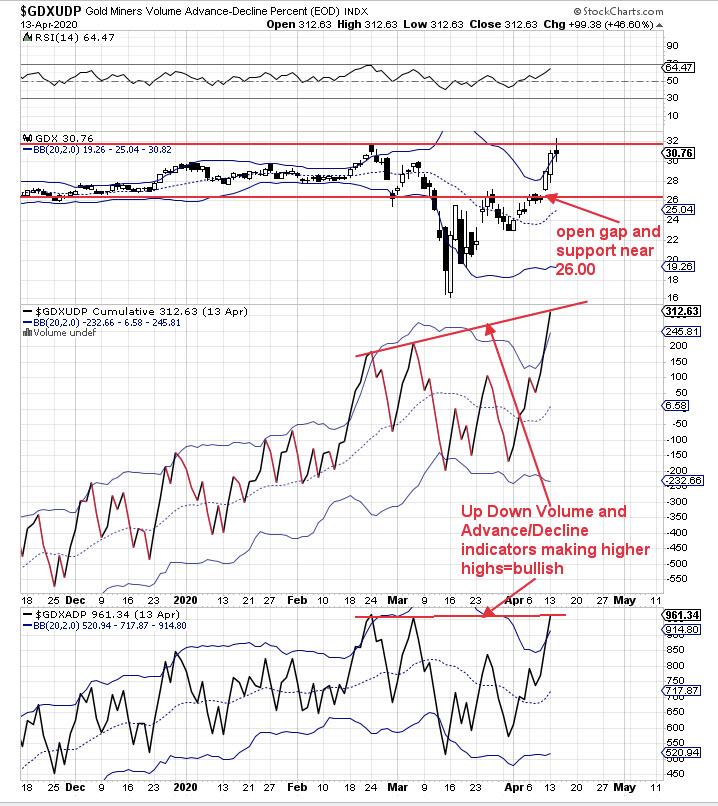
Again, GDX is back at the breakout area near 31.00. GDX has resistance near 31.00 and support near 26.00. The 26.00 support area also has an open gap that the market may attempt to fill before breaking out above 31.00. Don't know if gap will get tested, but, if it does, it would be a good place to add to positions at that level. We have two indicators below the GDX window, which are the cumulative Up Down Volume percent and, below that, the cumulative Advance/Decline percent. Both indicators are showing a positive divergence making higher highs, suggesting that at some point GDX will break higher. The big "Whipsaw" from the February high is over. The Bullish Percent index for the Gold Miners index stands at 92.31% (92.31% of the stocks in the Gold Miners index are on buy signals). Long GDX on 4/9/20 at 28.96.
Tim Ord,
Editor
www.ord-oracle.com. New Book release "The Secret Science of Price and Volume" by Timothy Ord, buy at www.Amazon.com.