
SPX Monitoring purposes; Short SPX on 4/21/20 at 2736.56
Monitoring purposes GOLD: Long GDX on 4/9/20 at 28.96
Long Term Trend SPX monitor purposes: Flat
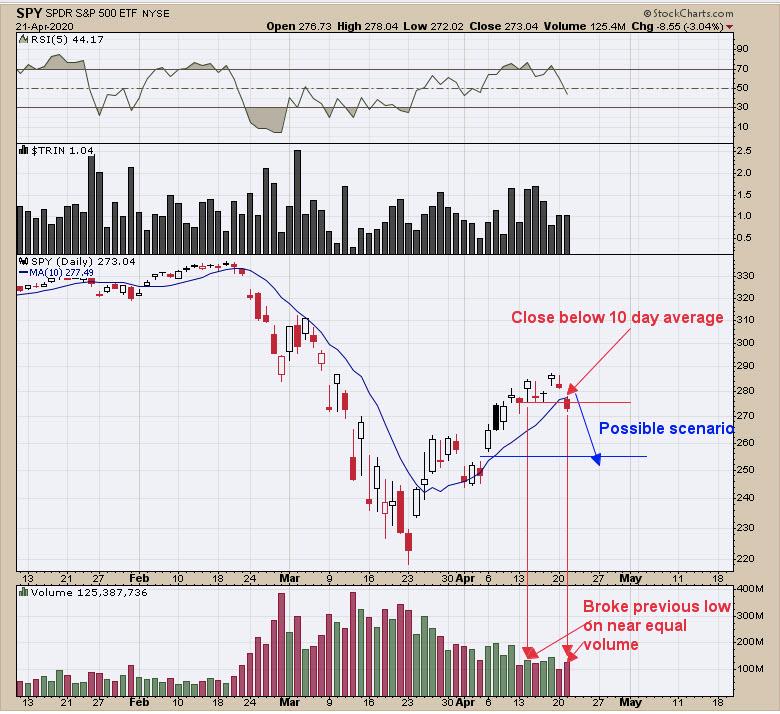
We were thinking at one point that Friday's high could be tested. With today's decline breaking the lows of the last five days, Friday's test is unlikely. Today's decline broke below the last five days on near-equal volume, which implies a valid break. SPY also closed below its 10-day average, along with a high VIX close - all of which suggests the down move may continue. Next area of support comes in at the April 6 gap level near 255 on the SPY. Short SPX on 4/21/20 at 2736.56.
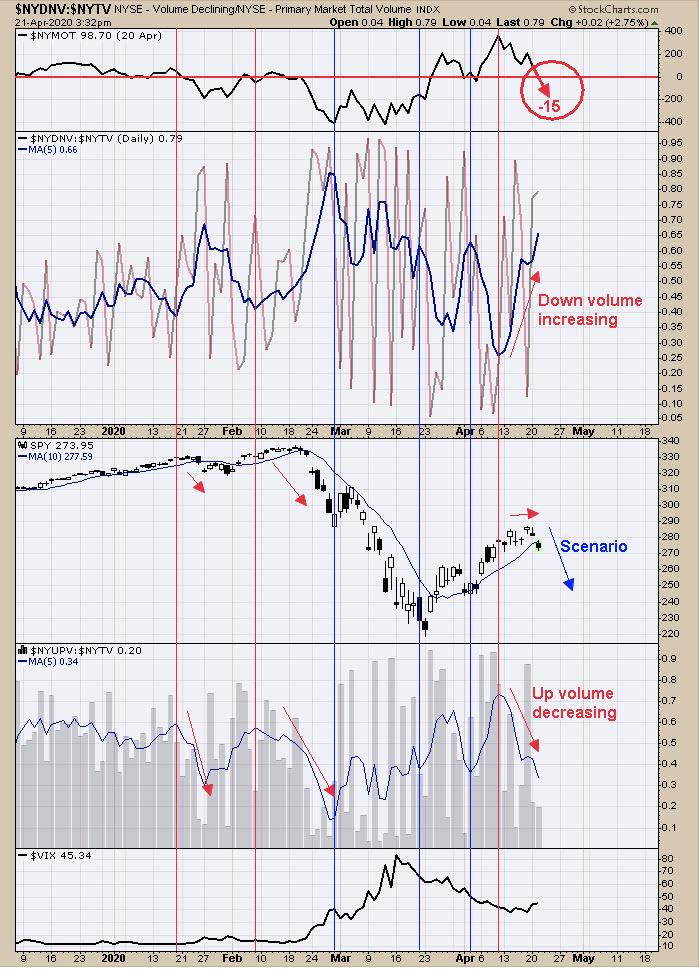
The top window is the McClellan Oscillator which will close around -15 today and below "0", a bearish sign. The next window down is the NYSE Down Volume/NYSE Total volume ratio. This ratio shows that down volume compared to total volume has been increasing since April 13, which in turn is showing traders on hitting on the sell button. The third window up from the bottom is the NYSE Up Volume/NYSE Total volume ratio. This ratio has been falling since April 13, showing that traders are backing away from the buy side. Today, the SPY closed below its 10-day moving average, which shows momentum may be turning down. Today, the SPY did gap down and sometimes the gap is tested before moving lower. There is also a gap on 4/6/20 near 255, which for now is a possible downside target.
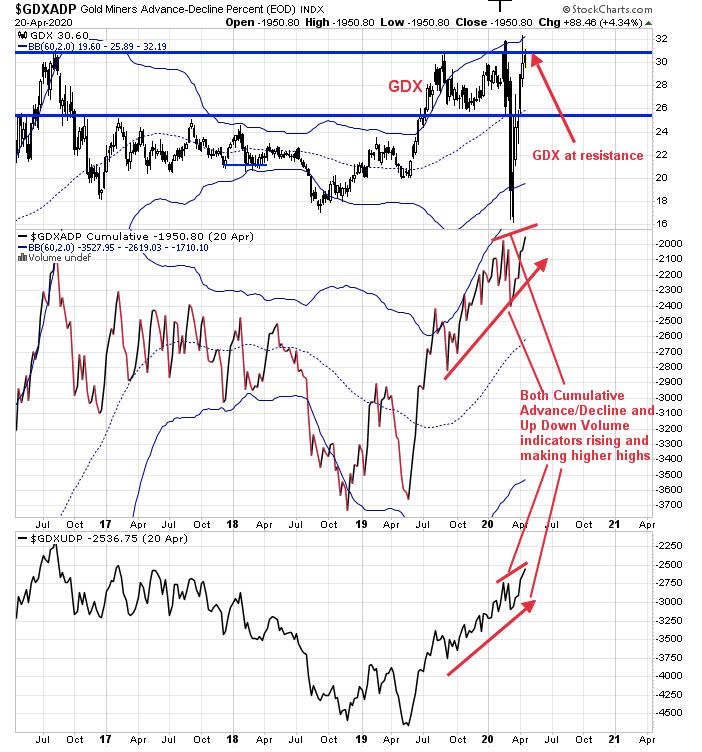
The chart above looks at the internal strength for GDX. Yesterday, we looked at the daily internals; the above chart is the weekly internals. The bottom window is the weekly cumulative advance/decline percent. GDX is back at the old highs and resistance near 31.00, and the weekly Cumulative Advance/Decline is rising and making higher highs and a bullish divergence, suggesting the 31.00 resistance level may give way. The next window up is the weekly cumulative Up Down Volume percent, which is also rising and making higher highs, suggesting the 31.00 level may fall. So far, GDX has not backed away form the 31.00 resistance level. If a market doesn't back away from a resistance level, it will eventually eat through the resistance. There is still a possibility the market could retrace back to support near the 26.00 range before breaking the 31.00 resistance, but the weekly chart suggests the 31.00 will give way. Long GDX on 4/9/20 at 28.96.
Tim Ord,
Editor
www.ord-oracle.com. New Book release "The Secret Science of Price and Volume" by Timothy Ord, buy at www.Amazon.com.