In this article, we will look at the On Balance Volume Index (OBV) and determine if it can help give us a leading edge in the direction of the $SPX, $INDU and $COMPQ indexes. Joseph Granville developed this Index and wrote about it in his book A New Strategy of Daily Stock Market Timing for Maximum Profit (1976).
From StockCharts.com's ChartSchool - "On Balance Volume (OBV) measures buying and selling pressure as a cumulative indicator, adding volume on up days and subtracting it on down days... It was one of the first indicators to measure positive and negative volume flow. Chartists can look for divergences between OBV and price to predict price movements or use OBV to confirm price trends."
The $INDU and $SPX have been in a range, as discussed in my previous article from May 7, 2020, "Coils, Coils and More Coils". Now, two weeks later, those indexes are still in coils (sideways range), while the $COMPX has continued its upward move and is close to challenging the highs from February 2020, prior to the sharp decline.
While there are tradable patterns within sideways ranges, the larger moves are born from the coiling, sideways patterns. Eventually, one side will win the battle. As technical analysts, we want to employ tools that may help us gain insight and an edge as to direction or confirmation of a directional move.
OBV may be one of those tools that can give us that information. Looking at Chart 1 of the $SPX Daily below, we can see the market has had a sharp move down and a sharp move up, and has been in a sideways pattern since mid-April 2020.
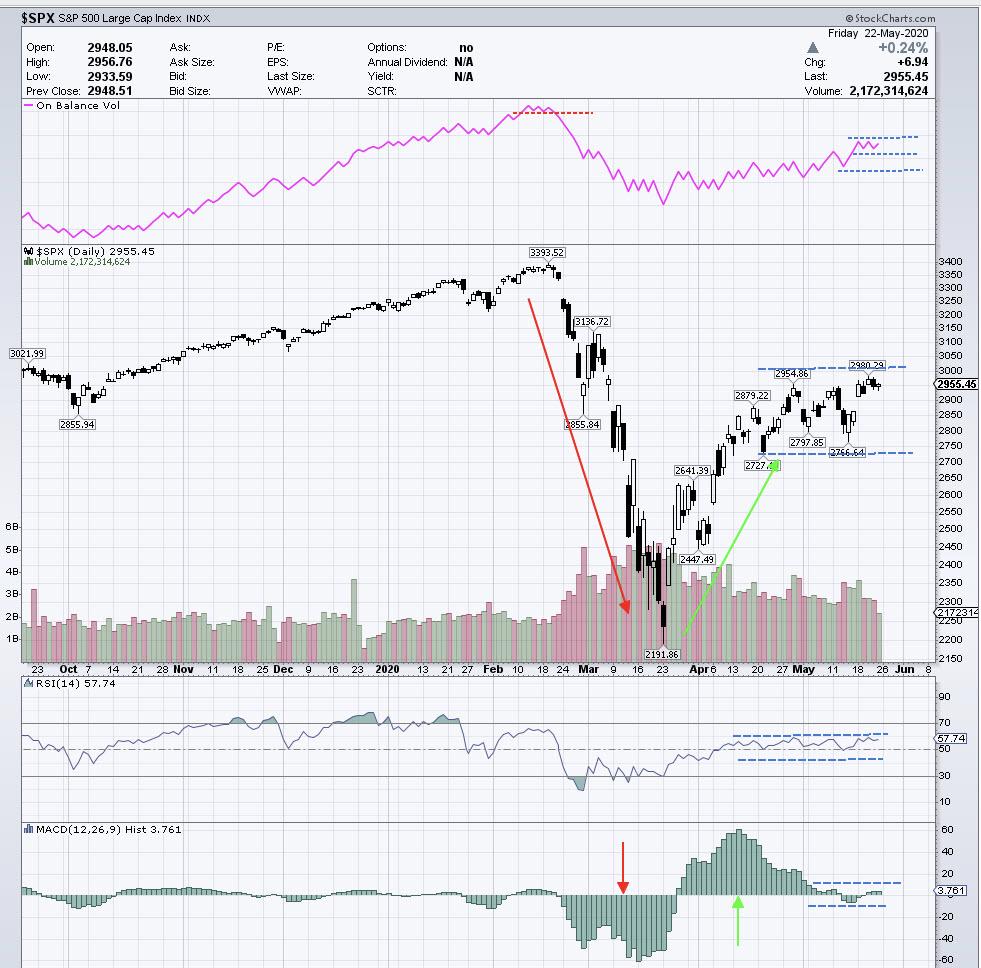 Chart 1 - $SPX Daily
The RSI in the lower window shows a sideways pattern, as does the MACD below it. There was a price attempt with a slight new high on May 20, 2020, but it so far has failed to close above the range with strong bars.
Note the OBV in the upper window. I have marked in blued dashed lines, support and resistance levels to watch carefully. We want to closely monitor if price moves to another high out of the range - if that happens, will OBV then also make new highs? Or does it break the support with lower prices?
If OBV breaks the support while still in this range, it may very well indicate lower prices. Conversely, if OBV makes a new high above the current high, then higher prices are the likely direction.
Also, in Chart 1, observe the pattern of resistance OBV formed at the February 2020 highs, as well as the subsequent break of that support just as the market started its decline.
Chart 2 below is of the $INDU, which has had a similar sideways pattern as the $SPX.
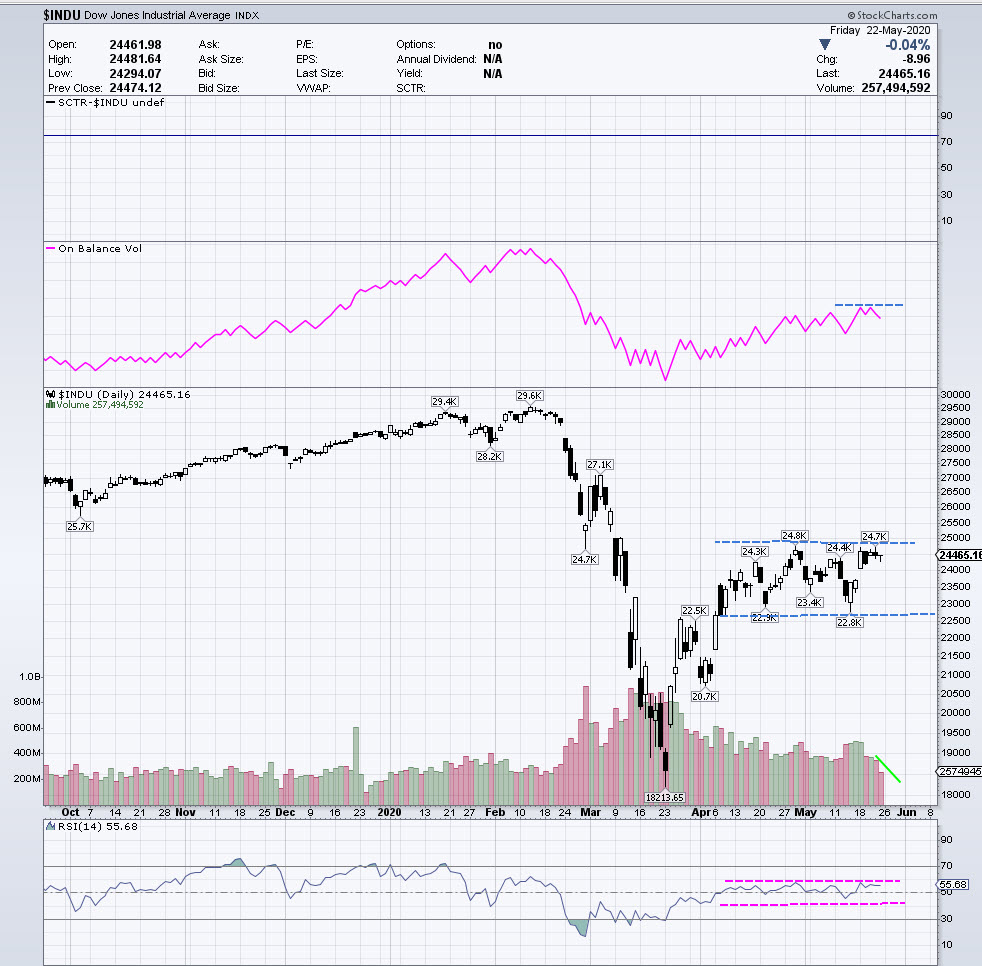 Chart 2 - $INDU
If we compare the $SPX in Chart 1 with the $INDU in Chart 2, we can see that $INDU has been weaker. Price has not retraced as much of the down leg as $SPX and $COMPX, with the latter being the strongest. Also, OBV has not been as strong as what has been seen in the other two indexes.
However, the same principle applies - if price moves up and above the current sideways range, OBV should also break the resistance marked on the chart, or it would be a negative divergence.
Chart 3 shows the $COMPQ, and we can immediately see the strength up from the March 2020 lows.
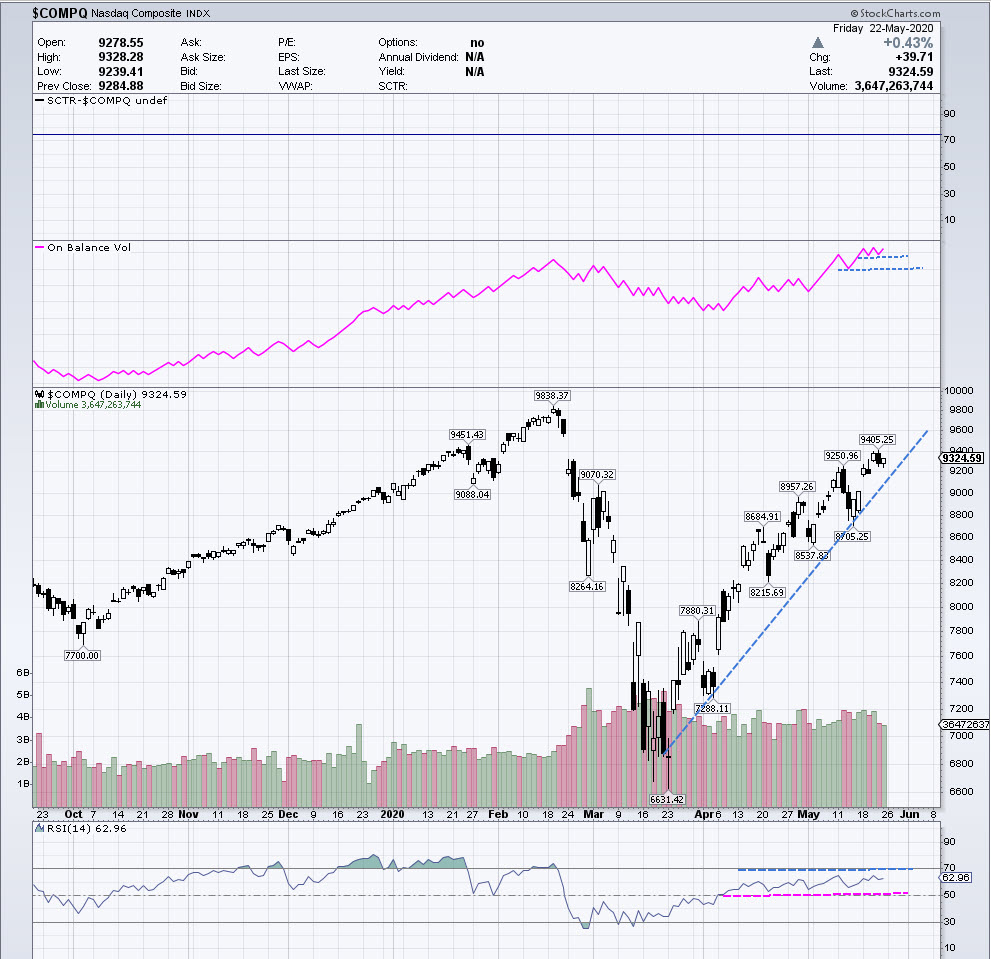 Chart 3 - $COMPQ
This chart of $COMPQ is not in a sideways range, but is showing price trending up and OBV making highs above the February 2020 highs. Notice also how, at the lows of March 2020, OBV held strength and has been making higher highs and higher lows, confirming the uptrend. If you take a few minutes to compare this OBV with that of Chart 1 ($SPX) and Chart 2 ($INDU), you will see the index divergences in strength.
I have drawn in a trendline on the $COMPQ chart. In the event this trendline were to be violated to the downside, you want to see OBV confirm that break, a corresponding trendline break with a turndown of OBV and break of support.
Currently, though, OBV is leading and making new highs in the $COMPQ and, unless there is a violation of the trendline with a reversal (break of support) in OBV, then new price highs should be anticipated. The next area of challenge for the $COMPQ is the large gap area from late February 2020.
Since $SPX and $INDU are within ranges, we can monitor OBV for signs of breaking its resistance (anticipate higher prices) or breaking its support (anticipate lower prices).
These three indexes appear to be very close to a larger price movement, with the $SPX and $INDU breaking out of the current sideways ranges and the $COMPQ continuing the uptrend or correcting down. The On Balance Volume Index should be a very good tool to keep an eye on in the coming days.
Reference: Technical Analysis, The Complete Resource for Financial Market Technicians, Second Edition, by Charles D. Kirkpatrick II and Julie R. Dahlquist
Note: None of the markets, ETFs or stocks listed in this article are recommendations to buy or sell, this article is intended for educational purposes only.
It's always important to learn entry skills, which include combining elements of intraday time frames, momentum indicators and other price patterns to control risk and also, at times, waiting on the sideline until there is confirmation.
There are trading techniques that can be learned and implemented to control risk and monitor the price behavior. We never know what price will do and the only element we can control is the risk.
If you would like to learn more about these patterns and programs in order to learn how to trade them, please visit me at my website www.tradingliveonline.com or feel free to email me at ljouflas@msn.com.
Best wishes for successful trading!
Leslie Jouflas, CMT
Please join me online for the MoneyShow Virtual Event June 10-12, 2020!
Contraction and Expansion Phases Using the AB=CD Pattern
Registration Link: https://online.moneyshow.com/june-2020/speakers/52f3d8b86e9343feb0224df7a0e9ade0/leslie-jouflas/?scode=050245