
SPX Monitoring Purposes; Long SPX on 9/25/20 at 3298.46; sold 10/2/20 at 3348.94= gain 1.53%
Monitoring Purposes GOLD: Long GDX on 7/8/20 at 38.96; Sold 9/21/20 at 39.76= gain 2.26% gain
Long Term SPX Monitor Purposes: Neutral
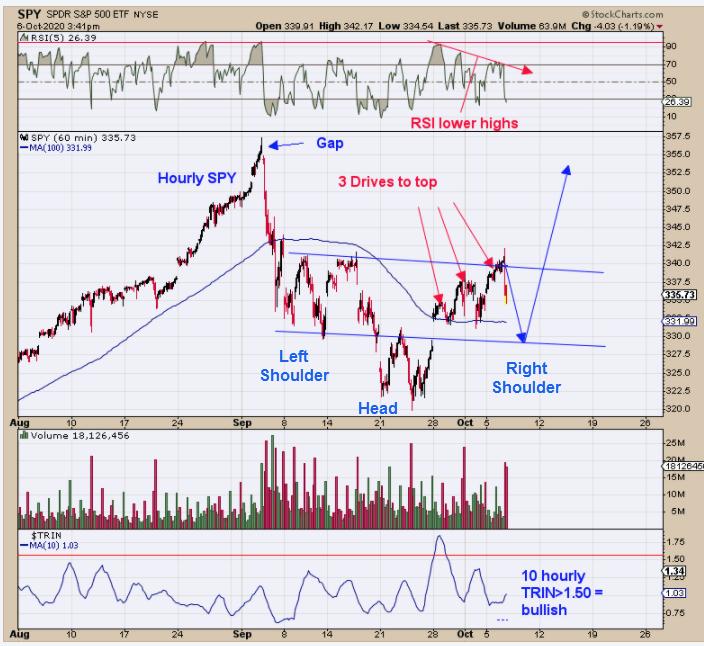
Yesterday, we said (and it is still playing out), "Above is the hourly SPY chart. The pattern forming on the hourly SPY going back to last Monday appears to be a 'Three Drives to Top.' This pattern has a downside target to where the pattern began, which is near last week's low (330 SPY). Also notice the RSI has been making lower highs as the SPY has made higher highs, showing upside momentum is weakening. The larger pattern that may be forming on hourly SPY is a 'Head and Shoulders Bottom' where the 'Head' is the late September low and the 'Right Shoulder' is forming now. This potential pattern has a target back to the early September high. Turnaround Tuesday (tomorrow) could start the pull back process to test the gap area and form the 'Right Shoulder.'" Sold our long SPX position last week for a gain of 1.53%.
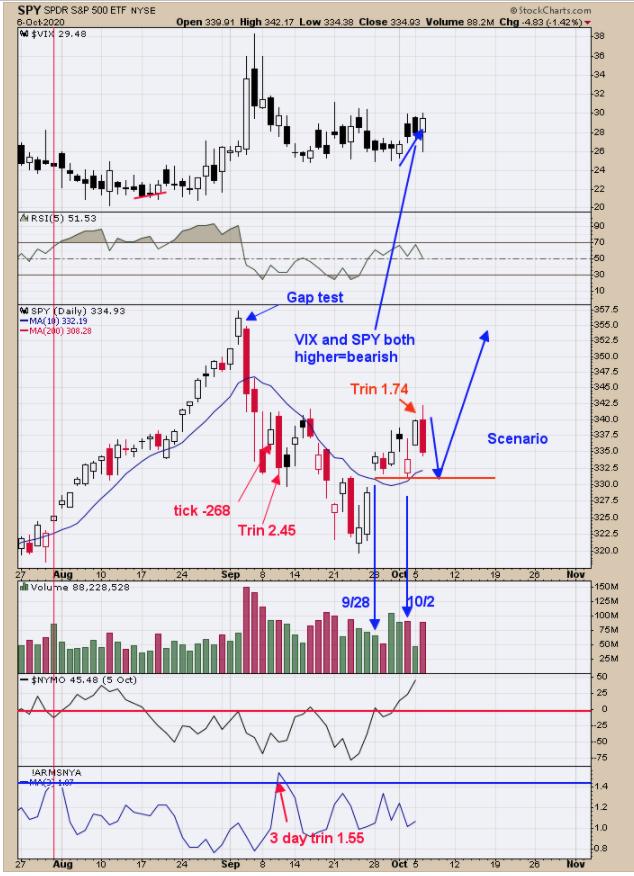
The October 2 low tested the September 28 low on higher volume (see chart above), suggesting the October 2 low will be tested again and could be the next downside target for a low (around the 330 SPY). Today the TRIN closed at 1.74 , showing panic and suggesting a low in the market is not far off. For a bullish setup, both the TRIN and TICK need panic readings within one day of each other. Therefore, if the tick closes near the -300 range tomorrow, a bullish setup could form.
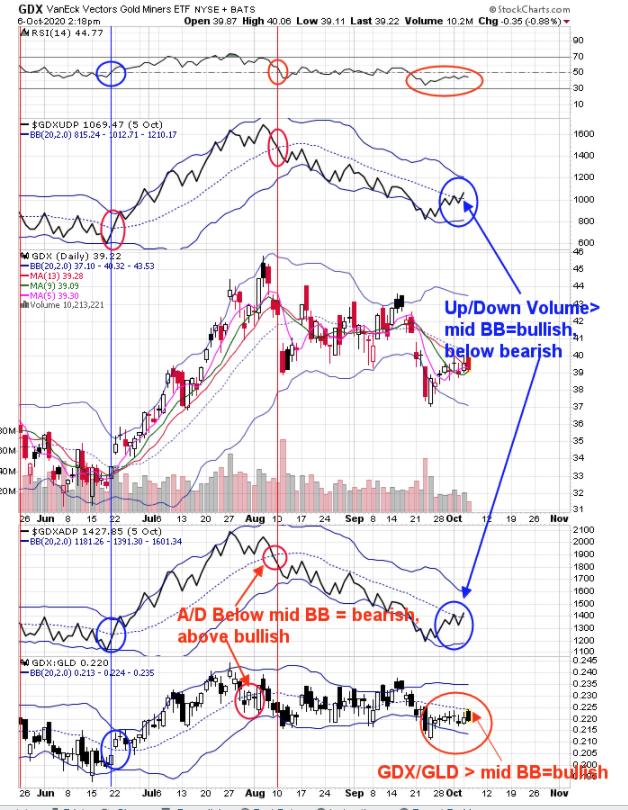
We updated this chart from yesterday. The bottom window is the GDX/GLD ratio. A bullish trend in GDX is present when GDX/GLD ratio is above its mid Bollinger Band and a bearish one when below. So far, it is below its mid Bollinger band. The next window up is the Cumulative Advance/Decline for GDX; when it's above its mid Bollinger band, GDX is considered in an uptrend, while below means a downtrend. Yesterday, this indicator closed above its mid Bollinger band and a bullish sign. The window above the GDX chart is the cumulative Up Down Volume; when cumulative Up Down Volume is above its Bollinger band, that's a bullish sign for GDX, while below is a bearish sign. Yesterday, this indicator closed above its mid Bollinger band and a bullish sign. The top window is the RSI for GDX; above 50 is bullish and below 50 bearish. It has been trending below 50 the last couple of weeks and so far remains bearish. For a bullish trigger, all four indicators should flip to bullish and, so far, two of the four are bullish. Staying neutral for now.
Tim Ord,
Editor
www.ord-oracle.com. New Book release "The Secret Science of Price and Volume" by Timothy Ord, buy at www.Amazon.com.