
SPX Monitoring purposes; Sold long SPX on 12/21/20 at 3694.90 = gain 1.3%; long 12/14/20 at 3647.49.
Monitoring purposes GOLD: Long GDX on 10/9/20 at 40.78.
Long Term SPX monitor purposes; Long SPX on 10/26/20 at 3400.97.
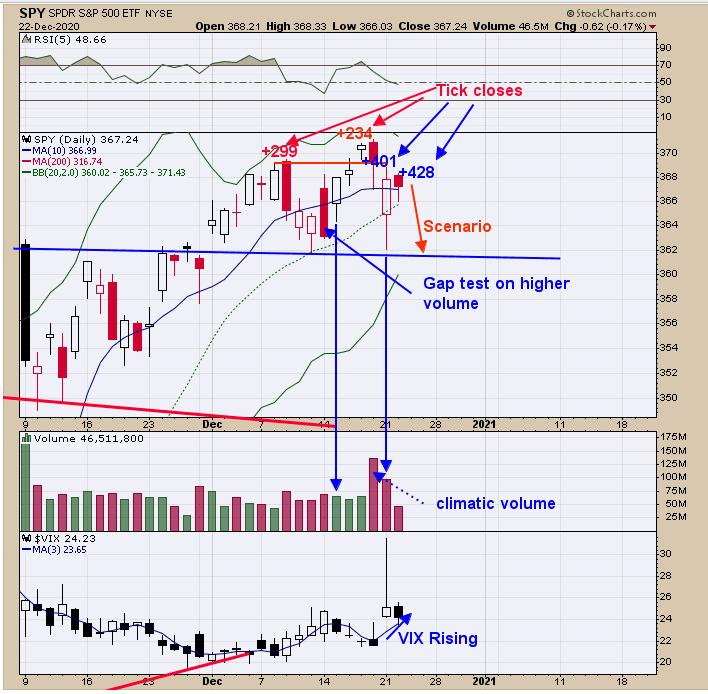
We labeled the tick closes that reached extremes levels over the last several day and all that exceeded +233 came at short term highs. Yesterday's tick closed at +401 and today's at +428. Extreme plus tick closes suggests short term exhaustion. What may transpire in the short term is a test of yesterday's low near the 362 level as yesterday's volume was higher than the previous days low it tested; most high volume lows are tested. Not a bear here but market appears to be in a trading range that may last several more days We don't think any major move is coming but yesterday's low could be tested again. We sold our short term SPX position yesterday for a 1.3% gain and will stay neutral for now.
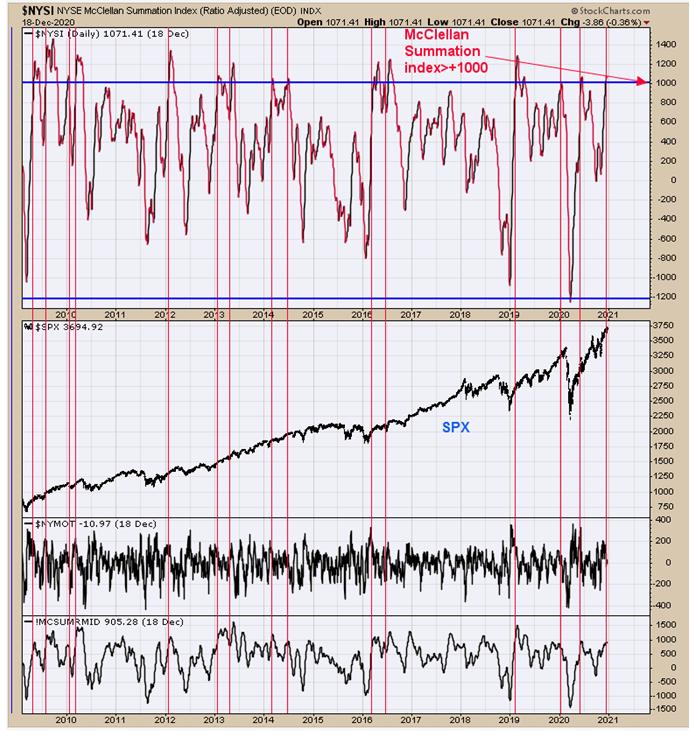
Yesterday's intermediate term commentary covers our view for the next several weeks, we said, "Above is an intermediate term view of the market. When the NYSE McClellan Summation index reaches above +1000 (current reading is +1071.41) the market intermediate term is in good condition. There can be short term pull backs (after +1000 McClellan Summation index) but market usually goes on and makes higher highs. Normally intermediate term tops form when NYSE McClellan Summation index turns down before reaching +500. Market weakens first before intermediate term tops form. Sentiment is terrible but momentum rules all and for now the momentum is up."
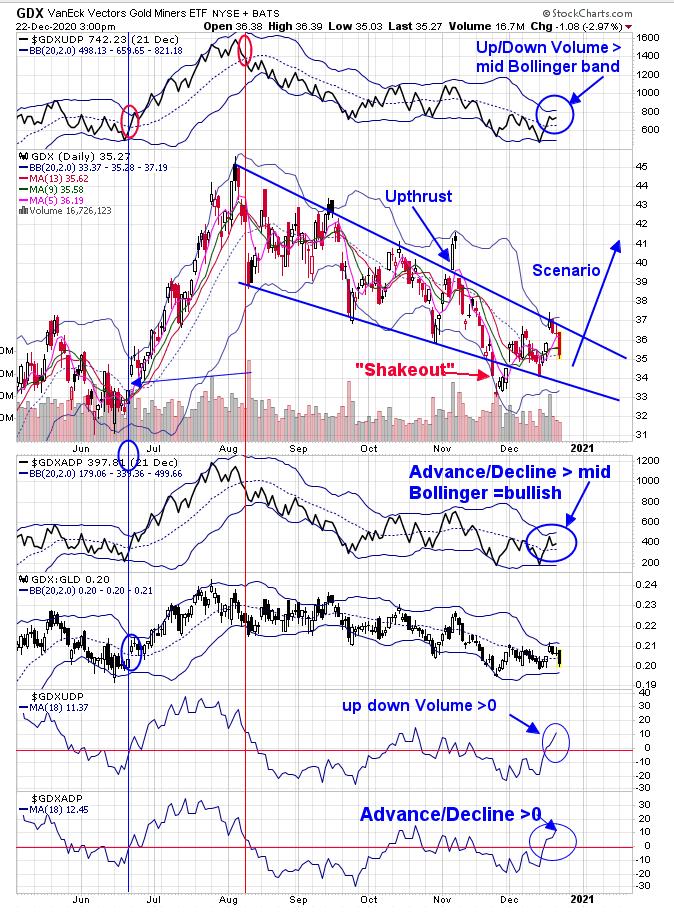
The top window is the cumulative GDX Up Down volume with its Bollinger band. Uptrends occur when this indicator is above its mid Bollinger band; which it is. Next window down is GDX. Back in early November an "Upthrust" (we where thinking at the time a breakout) which if it doesn't hold the trend line it will attempt to breakout to the downside (which it did). The breakout to the downside created a "Shakeout" if it fails to hold below the trend line (it closed above). A "Shakeout" suggests it will now break above the upper trend line (which hasn't happen yet but should in the next several days). Next window down is the cumulative A/D and a close above its Bollinger Band is a bullish sign (above BB). Bottom window is GDX Advance/Decline with 18 MA and >0 is bullish (current reading is +12.45). Next window up is GDX Up Down Volume with 18 MA and is also >0 (closed at 11.37). Don't think market is breaking down there but rather gaining strength to start an impulse wave higher Long GDX on 10/9/20 at 40.78.
Tim Ord,
Editor
www.ord-oracle.com. New Book release "The Secret Science of Price and Volume" by Timothy Ord, buy at www.Amazon.com.