
SPX Monitoring Purposes: Sold long SPX on 12/21/20 at 3694.90 = gain 1.3%; long 12/14/20 at 3647.49.
Monitoring Purposes GOLD: Long GDX on 10/9/20 at 40.78.
Long Term SPX Monitor Purposes: Sold long SPX on 1/15/21 at 3768.25= gain 10.80%; Long SPX on 10/26/20 at 3400.97.
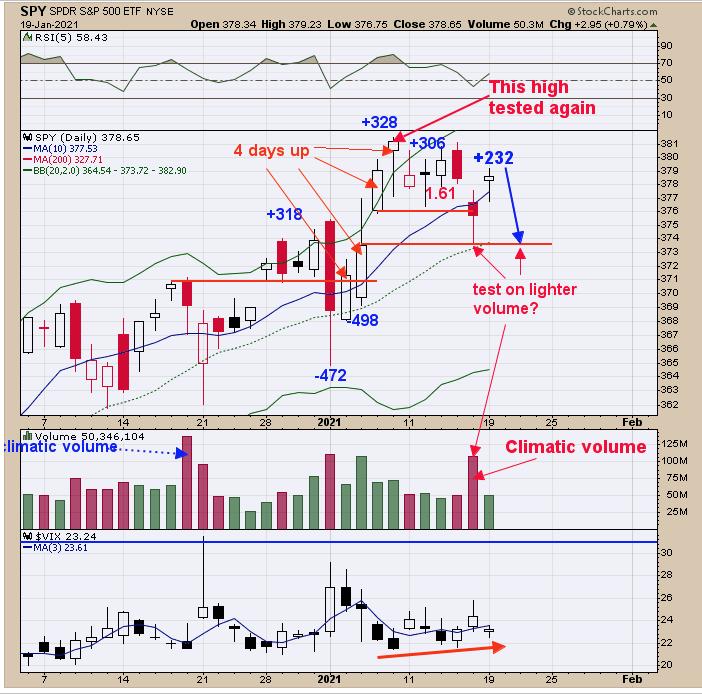
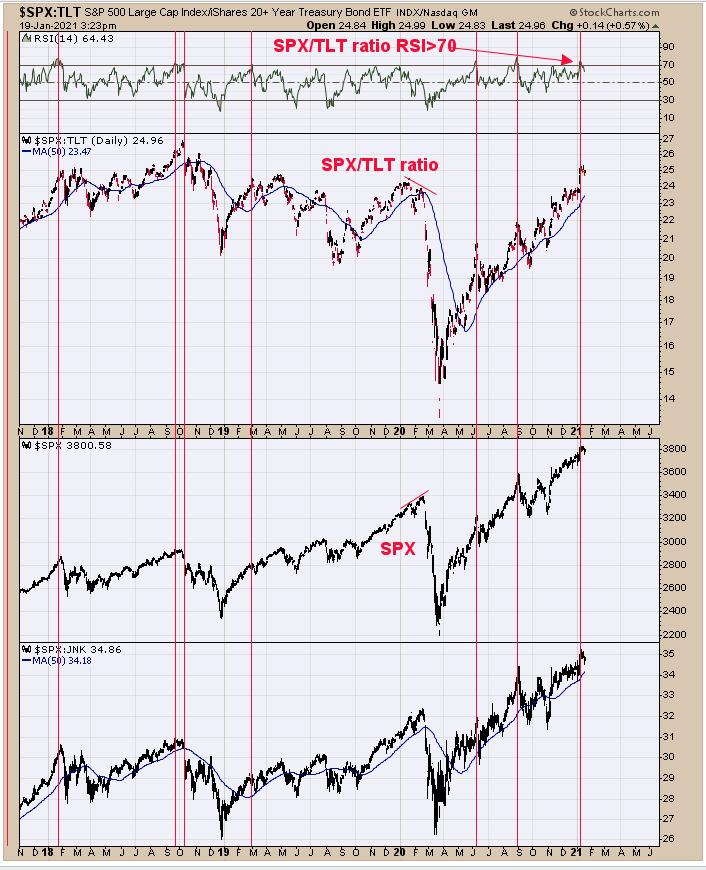
We updated this chart from last Thursday. Last Thursday, we said, "Above is the daily SPX/TLT ratio (SPX 500/ 20 yr Treasury) going back three years. When the RSI of the SPX/TLT ratio gets above 70 (red vertical lines), short term highs are common. January 8 the RSI closed at 75.08, the highest RSI reading so far and also the highest SPX price." Because of the SPX/TLT RSI >70, it would seem upside is limited. We don't think a large correction is in the making right now, but a consolidation or trading range is likely. Another interesting statistic is that, on Inauguration Day, the market is up only 30% of the time (from 1921 to 2017), suggesting tomorrow has a 70% chance of being down.
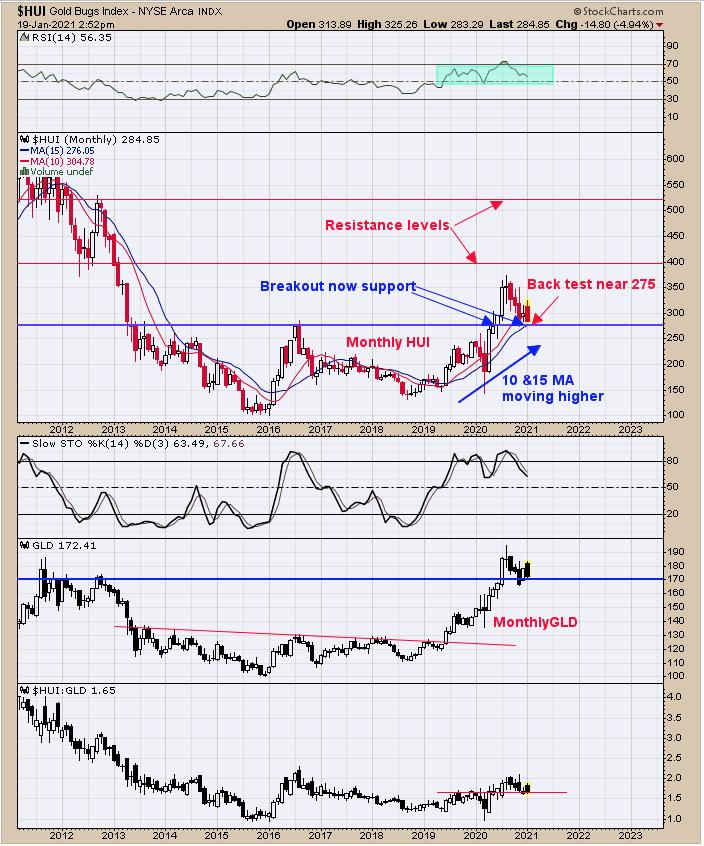
Last week, we showed the weekly GDXJ chart (which is bullish). Above is the monthly HUI. Monthly HUI had a major breakout in June 2020 near the 275 range, and that once resistance level now turns into support. The current price for HUI is near 284 and, if the market did go back to test the breakout level near 275, it would mean a drop of 3.5%. Overhead resistances are the 2012 low near 400 (41% rise from here) and 2012 high near 525 (85% rise from here) and will be upside targets. The monthly 10 and 15 moving averages are rising, which suggests momentum is up. It appears the market is using up time before the next rally begins. Being patient for now. Long GDX on 10/9/20 at 40.78.
Last week, we showed the weekly GDXJ chart (which is bullish). Above is the monthly HUI. Monthly HUI had a major breakout in June 2020 near the 275 range, and that once resistance level now turns into support. The current price for HUI is near 284 and, if the market did go back to test the breakout level near 275, it would mean a drop of 3.5%. Overhead resistances are the 2012 low near 400 (41% rise from here) and 2012 high near 525 (85% rise from here) and will be upside targets. The monthly 10 and 15 moving averages are rising, which suggests momentum is up. Appears market is using up time before the next rally begins. Being patience for now. Long GDX on 10/9/20 at 40.78.
Tim Ord,
Editor
www.ord-oracle.com. New Book release "The Secret Science of Price and Volume" by Timothy Ord, buy at www.Amazon.com.