The battle between bond traders and the Federal Reserve is starting to heat up as bond yields wrestle with crucial overhead resistance and the broad market continues in lockstep with bond yields. But as the action on 2/20/21 shows that, despite the midweek jitters, bond sellers remain a force to reckon with.
At the same time, this is a highly unnatural relationship, which means that, although we are trading it on the long side, we should not trust it. What I'm saying is that even as the market may make new highs from here as bond money moves into stocks, the odds of a correction in stocks are likely to rise as this strange phenomenon continues.
Over the last two weeks in this space, I have described how rising bond yields have exhibited a high correlation to rising stock prices. My rationale has been that, as the Fed continues with QE, the bond market has been showing its inflationary concerns. Moreover, I noted that the three macro reasons for the bullish case in stocks for an extended period of time, until proven otherwise, were:
- The Federal Reserve's QE will be in place for a long time
- Bond traders are selling bonds and buying stocks
- There is a much bigger wall of worry in place than most realize
So now that the cat's out of the bag and others have noted the same dynamic, it's time to see how this situation resolves. Certainly, last week's volatility made for a tough trading environment. But things could change rapidly, for the better or for the worse. And it all depends on whether money from the bond market continues to make its way into stocks.
COVID Side Effects in the Presence of Bottlenecks
At the centerpiece of my argument for the changing landscape in the markets (and in real life), the system comprised of the markets (M), the economy (E) and people's life decisions (L), has been the COVID-19 pandemic and the seismic behavioral and structural changes precipitated by it:
- Supply chain disruptions and subsequent inflationary pressures
- Population migration into the suburbs, smaller towns and rural areas, increasing demand for housing amidst totally inadequate supply
- The increasing dependence on the markets by the general population for income, which increases the market's volatility and now in Texas, perhaps elsewhere
- The failure of key infrastructure such as oil and natural gas production and the energy grid due to natural disasters and the apparent lack of backup systems
Certainly, the Reddit short-squeeze episodes validate the third bullet above. But more important is the fact that the recent record-setting Producer Price Index confirms the data provided by previous ISM and Purchasing Manager reports, which pointed to inflationary pressures resulting from supply chain tightening. Now, when you add in the occurrence of an unexpected natural disaster in an unprepared area during a time when there are bottlenecks everywhere, life gets interesting and outcomes become more uncertain.
All of this combined, of course, raises the question "where do we go from here?" Well, the short answer is that, until proven otherwise, the Fed, as it told us in their most recent minutes, isn't changing a thing, which suggests that bond traders will likely continue to sell bonds over time. Of course, the rise in bond yields may slow and get volatile, but, unless something very drastic happens or the uptrend in yields has actually run its natural course due to market conditions, it isn't likely to stop until the Fed pulls the trigger and actually raises the Fed Funds rate, or signals that it will taper its QE.
Moreover, there is no evidence that supply chains are likely to return to "normal" anytime soon, especially with housing demand not likely to slow much even as higher mortgage rates loom. An example is the recent rise in lumber prices, due to COVID-19 related shutdowns of processing plants creating a supply squeeze just as housing demand and housing repair demand has skyrocketed.
Specifically, consider the nearly 100% correlation in the general trend of homebuilder DR Horton (DHI, lower graph in upper chart panel) over the last twelve months in comparison to that of the price of lumber.
Something is Lurking in the Shadows
Finally, there is something lurking out there which could further upset the entire apple cart in a major way, and it goes something like this. The U.S. Treasury is about to unleash $1.1 trillion in fiscal liquidity – stimulus checks - over the next three months. And - drum roll - the banking system, due to Fed regulations, is not equipped to handle it.
Yeah, you heard right. The banking system won't be able to handle that much money at once since the Fed is already flooding it with its QE and there are obscure regulations that limit the banking system's ability to process the money due to reserve rules.
But now it gets even better. With so much money in the system, short-term rates may go negative as the system scrambles to accommodate it. And, when that happens, if it does, then we can expect big problems in the, yup, REPO market.
So it is plausible that what we're seeing in the bond market is at least partially influenced by what we're seeing behind the scenes with Treasury and the Fed. Stay tuned and keep a close eye on things.
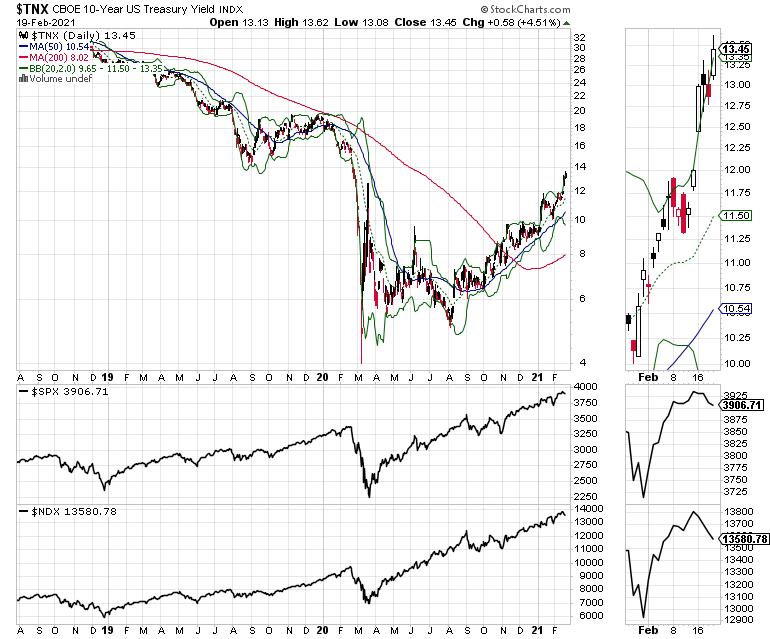
Bond Yields and Market Breadth Regain Uptrend after Temporary Setback
As I've noted here over the last three weeks, so far in 2021 the rise in bond yields has had a high correlation to rising stock prices. But now that bond yields have broken above key resistance points, those being 1.2% for the U.S. Ten Year note (TNX) and 2.0% for the 30 Year bond (TNX), it is imperative to see how this whole thing resolves. Moreover, even though bond buyers returned to the market midweek and stocks old off, by the week's end bond sellers and stock buyers came back in and the parallel uptrends in bond yields and stocks regained lost ground.
Certainly, the rising trend in yields may be nearing a period of consolidation. We may even see a dip below the now important support levels – see above – that were once resistance. But it remains to be seen whether this simultaneous uptrend in bond yields in stocks can be deterred without intervention from the Federal Reserve. In other words, what happens in the next few days and weeks may well define what happens over the next few months in this important and newly redefined intermarket relationship. Stay tuned.
Have you thought about where to invest as bond yields rise? Find out with a Free Trial to my service (click here).
Contrarian Alert: Non-Sexy Raytheon Chart Suggests Big Move Ahead
Shares of Raytheon Technologies (RTX) seem to be poised for a big upside move, an especially bullish development since there are no major news regarding the company and there are no major voices talking the stock up.
RTX is best known for its missile and related defense systems, but the company is also active in the civilian aerospace market, where it develops and installs airline safety and general operation systems as well as being an active participant in the after-market segment (used parts) through its engine division, Pratt and Whitney. Moreover, RTX merged with United Technologies in 2020, a fact that has been forgotten in the COVID-19 news cycle, but one which gives the new RTX entity a great deal of leverage, diversification and scale in the aerospace sector and is likely to enhance its earnings potential in the future, as air travel and the global economy hopefully improve.

Sure, RTX had a good quarter recently, but the near-term guidance was not particularly exciting. Still, regardless of the lack of buzz on the stock, the price action is quite appealing. Thus, even though RTX is not sexy, it's hard to knock the price chart, which is highly suggestive of an impending breakout in light of no major apparent reason for it. In other words, the stock is being bought by investors with a long-term time frame, most likely mutual funds whose major goal is to own stocks which trend higher for a long time.
So why is a guy like me, who is known for looking for momentum stocks, looking at RTX? Well, aside from my contrarian side pushing me toward it, the price chart is hugely appealing. Consider the fact that it's above its 50- and 200-day moving averages, placing it in the Complexity Zone. Moreover, it has just crossed above the RSI 50 area while showing improvement in Accumulation Distribution (ADI) and On Balance Volume (OBV).
Anyway, if you're looking for the next Reddit short squeeze explosion, don't look here. But if you're willing to be a little patient, this may be a good place to put a bit of money down.
The bottom line is that money is moving into RTX steadily and it looks as if, over the next few weeks, the buyers will likely overwhelm the sellers. I'm willing to give this one a little room as long as it doesn't break too far below its 50-day moving average. More important, given the Volume by Price bars (VBP), there is almost no resistance above the $75 area, which means that a move above that area could move the stock higher in a hurry.
I own RTX as of this writing. For more stocks like RTX, consider a FREE trial to Joe Duarte in the Money Options.com (click here).
Market Breadth Survives Midweek Challenge; Indexes Fail to Recover
The New York Stock Exchange Advance Decline line (NYAD) managed a new high last week, but rolled over toward week's end. Still, the market's breadth outperformed the major indexes, which were mostly lower at week's end.

It is important to reinforce the fact that, as long as NYAD continues to make new highs, remains above its 50- and 200-day moving averages and has a corresponding RSI reading remaining above 50, the trend is up. This combined set of observations has been extremely reliable since 2016.

For their part, the S&P 500 (SPX) and the Nasdaq 100 (NDX) rolled over midweek, following bond yields which had a small correction. Interestingly, the indexes failed to recover along with the subsequent rise in the market's breadth and bond yields. So it will be important to monitor this divergence. Also worth watching is the action in Accumulation Distribution (ADI) and On Balance Volume (OBV) for SPX and NDX, which both rolled over last week.

The bottom line, though, is that if this pullback is similar to recent pullbacks, the RSI 50 area for NYAD will provide support. A failure there will likely lead to further selling.
Bonds Continue to Hold the Key
The bond market continues to be the key influence on stocks. Moreover, if the scenario described above regarding the banking system comes to pass, then, in retrospect, it may be obvious why bond sellers were so active and why yields continued to climb. Much remains to be seen, however, although there is never a point in trading the markets where some level of caution is not a good thing.
For more on how to deal with the current market, check out my latest Your Daily Five video here. For more details on bonds, currencies, and stocks, check out my recent interview with Wall Street Reporter.com here.
Joe Duarte
In The Money Options
Joe Duarte is a former money manager, an active trader and a widely recognized independent stock market analyst since 1987. He is author of eight investment books, including the best selling Trading Options for Dummies, rated a TOP Options Book for 2018 by Benzinga.com and now in its third edition, plus The Everything Investing in Your 20s and 30s Book and six other trading books.
The Everything Investing in Your 20s and 30s Book is available at Amazon and Barnes and Noble. It has also been recommended as a Washington Post Color of Money Book of the Month.
To receive Joe's exclusive stock, option and ETF recommendations, in your mailbox every week visit https://joeduarteinthemoneyoptions.com/secure/order_email.asp.
