Most individual and professional investors would agree that the day-to-day twists and turns in the stock market, and the intraday volatility, have significantly increased over the past few years. There are many reasons for this, including the surge in computer-based algorithmic trading, which now accounts for more the 80% of daily stock market volume, and the influence of micro-investing via firms like Robinhood. And this change in the market's character may be the "new normal," so we had better get used to it.
Whatever the reasons for these changes in the market's character may be, current conditions have certainly made it much more difficult for investors to navigate and manage their stock market portfolios — and maybe even more difficult to sleep at night. Managing day-to-day market risk is certainly more challenging than it's even been in my career and, amid these conditions, your emotions are often your portfolio's worst enemy.
Both personally and professionally, I have dealt with these treacherous market conditions by relying much more on data-driven quantitative models and much less on my own personal observations and opinions on the market. This data-driven, more mechanical approach is a bit humbling, as it acknowledges that I can't see or predict the future regardless of how much experience I may have. But, much more importantly, it keeps my emotions, opinions and ego out of the equation and keeps me performing the same way every day for myself and my clients, regardless of what is happening around me.
One of the quantitative tools I use to do this is called The Asbury 6, my firm's in-house, data-driven daily assessment of the internal health of the US stock market. I have frequently referred to the Asbury 6 in StockCharts TV's Your Daily Five and The Final Bar programs. I think of the "A6" as the stock market equivalent of a routine office visit to your family doctor, which typically includes a shortlist of routine evaluations of your health like taking your pulse, checking your blood pressure and taking your temperature. This repeatable battery of simple tests enables your doctor to establish a baseline assessment of your current condition and, from there, he or she can elect to send you on your way, request additional testing or send you to the hospital. In much the same way, the Asbury 6 checks the daily internal health of the stock market.
The Asbury 6, by design, includes only one price-based market metric. The other five are what I call secondary indicators; things like investor asset flows, which indicate investor conviction in a bullish trend, trading volume, which indicates investor urgency to buy or sell, and corporate bond spreads, which measure the bond market's assessment of credit risk. Because computers have pretty much taken over the day-to-day trading activity of the stock market, I have stacked the "A6" with non-price based metrics to act as a lie detector test -- to help thwart the near term misdirection that has now become a part of the risk in investing in stocks.
The table below shows that the Asbury 6 is currently Positive, or bullish, as five of its six constituents indicate a positive reading. Four or more metrics in one direction, either positive (green) or negative (red), are necessary for a tactical bias.
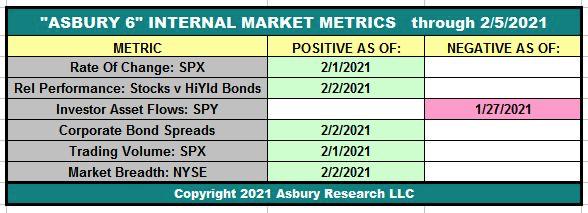 The Asbury 6 tactical model through February 5th, 2021. Copyright 2021 Asbury Research LLC
As long as the "A6" remains bullish, "our offense is on the field" - that is, we remain invested and are looking for opportunities to increase equity exposure. When the "A6" turns bearish (four or more negative constituent metrics), we shift to a defensive stance - meaning we are taking inventory of exactly what our equity exposure is, tightening protective stops on existing positions and generally looking to aggressively protect our capital.
The Asbury 6 is our own tool that generates a daily assessment of the market's internal health, but it is certainly not the only way to accomplish this. Both professional money managers and individual investors can certainly construct their own version of the Asbury 6, based on their own market knowledge, experience, investment time horizon, and favorite metrics that they understand and trust. The important takeaway is not so much which specific methodology and indicators that you use, but rather to have a data-driven, repeatable method of making important investment decisions that keep you consistent in your approach and keep your emotions from sabotaging your performance.
Sign up for Asbury Research's free Bi-Weekly Stock Market Update by Clicking Here. Learn more about our investment management approach by Clicking Here.
John
John Kosar, CMT
Chief Market Strategist, Asbury Research