
SPX Monitoring Purposes: Long SPX on 2/9/21 at 3911.23
Monitoring Purposes GOLD: Long GDX on 10/9/20 at 40.78.
Long Term SPX Monitor Purposes: Sold long SPX on 1/15/21 at 3768.25= gain 10.80%; Long SPX on 10/26/20 at 3400.97.
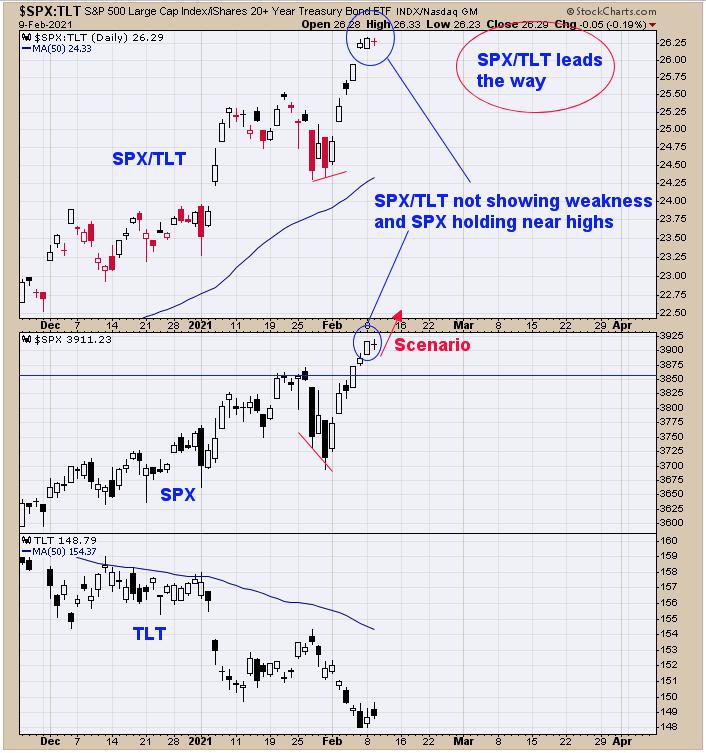
We sold our long SPX position last Friday because the market was up 5 days in a row - and a 4.65% gain in one week is hard to pass up. Monday marks 6 days in a row up and we predict market will be higher within five days 88% of the time. Today both SPX/TLT and SPX were modestly down and not giving a bearish or bullish lean. Momentum rules for now and momentum remains up. Did get panic in the TRIN close today of a reading of 1.55, which is covered on page two and the reason we are long on SPX on today's close.

It's unusual for a market to have a high TRIN close after being up 6 of the last seven trading days. Normally, as the market rallies for a number of days, the TRIN close gradually decreases and closes below 1.00, showing more traders are buying the rally. We consider that the TRIN readings are in panic levels when it closes above 1.35 and panic TRIN readings are a bullish short term sign for the market. Today, the TRIN closed at 1.55, suggesting the rally has further to go. It's common for the TRIN to close below .50 near highs. Momentum is up and the market may work higher short term.
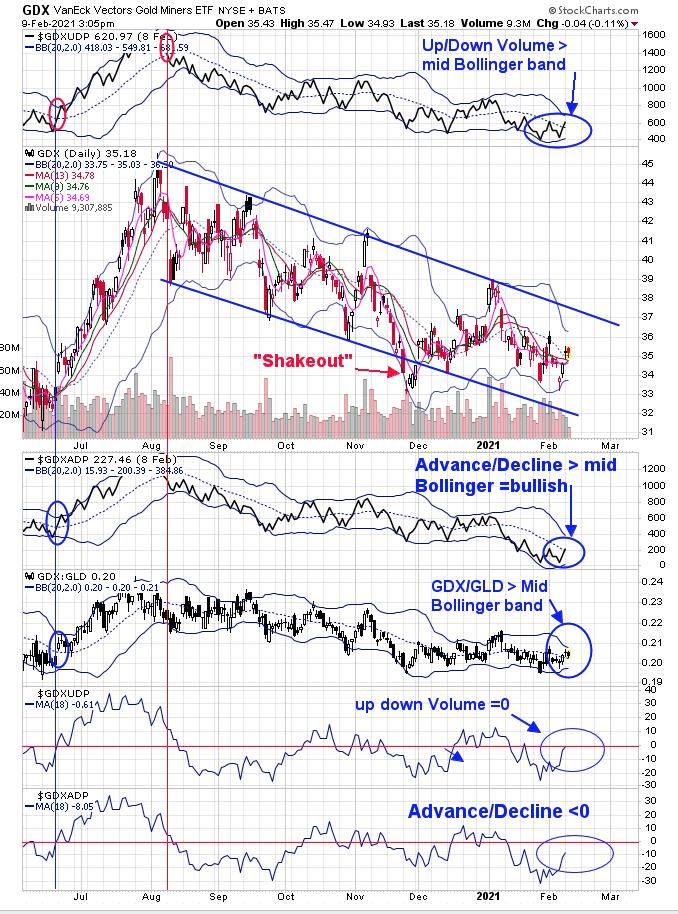
Above is GDX, along with short-term indicators that predict the short-term direction for GDX. The bottom window is the 18-day average of the Advance/Decline; above 0 is bullish, below 0 bearish and it's in negative territory. The next window up is the 18-day average for the Up Down volume; again, above 0 bullish and below bearish and its barely below "0" which is neutral. Next window up is the GDX/GLD ratio; above mid-Bollinger band bullish and below bearish. This indicator is above the mid-Bollinger band and bullish. Next higher window is the GDX Advance/Decline indicator with its Bollinger band; it is above the mid Bollinger band and bullish. The window above GDX is the GDX Up Down Volume indicator with its Bollinger band. This indicator is also above its mid-Bollinger band and also bullish. What needs to happen here is for the GDX to hold or adds to its gains short-term and the above indicators most likely will add to their bullish lean. Consolidation has been going on for six months and an impulse wave is due to begin. February has a history of marking a reversal in the gold market and this time around should be a low. The bigger picture remains bullish; the short-term picture is producing bullish divergences. Long GDX on 10/9/20 at 40.78.
Tim Ord,
Editor
www.ord-oracle.com. New Book release "The Secret Science of Price and Volume" by Timothy Ord, buy at www.Amazon.com.