
SPX Monitoring Purposes: Sold long 4/9/21 SPX at 4128.80= gain 6.16%; Long SPX on 3/24/21 at 3889.14.
Monitoring Purposes GOLD: Long GDX on 10/9/20 at 40.78.
Long Term SPX Monitor Purposes: Sold long SPX on 1/15/21 at 3768.25= gain 10.80%; Long SPX on 10/26/20 at 3400.97.
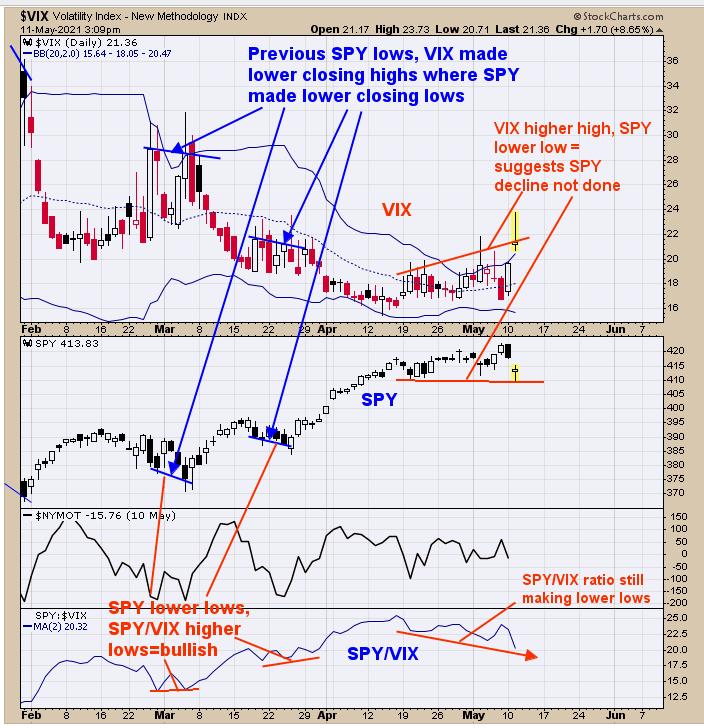
Above is the VIX, which trades opposite of the SPY (SPX). A bullish divergence occurs when the SPY makes a lower low and the VIX makes a higher low. This divergence is best shown in the bottom chart, which is the SPY/VIX ratio. In general, when the SPY is falling, so should the SPY/VIX ratio, and when there is a divergence, a reversal in the market may be near. In early and late March, there was a divergence for a bottom. So far, on this decline, we do not have a divergence, suggesting no worthwhile low forming here. We did have a downside target near 411 on the SPY, but so far we don't have a bullish setup. The bigger trend is up, but short-term consolidation is ongoing for now. This potential consolidation could last from this week into next week.
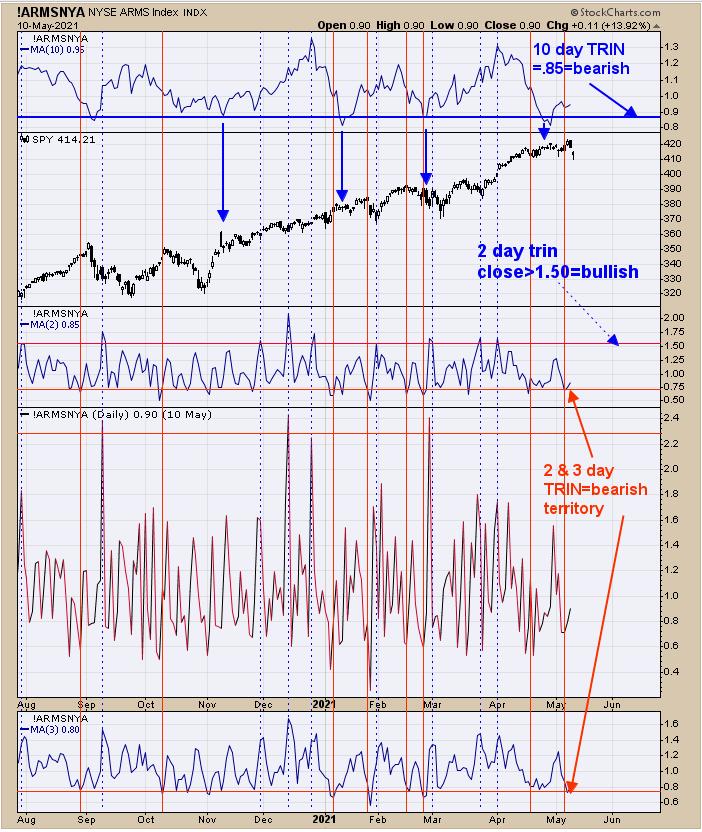
Yesterday, we said "The bottom window is the 3-day TRIN and third window up is the 2-day TRIN; when both are in bearish territory (like now), the market has a hard time going higher short-term. The red vertical lines show the previous times when 2- and 3-day TRIN were in bearish territory. The blue dotted lines show when the 2- and 3-day TRIN were in bullish territory and, in most cases, the market was near a low. The SPX did close at a new all-time high on Friday, but the TRIN readings were not in the fear levels needed to carry the market higher. The previous lows near 410 SPY are still possible." Today, the 410 level was tested, but the TRIN readings failed to reach panic levels, which suggests no bottom forming here. Today's volume did surpass the previous lows over the last couple of weeks and suggests, at a minimum, today's low will be tested again. Decline may continue into next week. Worst case scenario is a pullback to previous highs of March near 395 SPY. Staying patient for now.

We haven't looked at this chart in a while, which is the monthly Gold. Gold has 8- and 16-year cycles, which both bottommed back in January 2016. The January 2016 bottom in Gold marked a 50% retracement of the rally from the 2001 low to the 2011 high. A 50% retracement of the previous rally can mark the halfway point of the move up and would give a target near 2700 on Gold. Gold did find support near the previous high of 2011, which came in at the 1800 level of March of this year. It appears the rally has started from the March low. The bottom window is the XAU/Gold ratio. It's bullish when this ratio is rising and it has turned up in early 2019. The rally has much further to go both in time and price and 2700 on Gold should be an easy target. Usually, markets start out slow and end fast, and that could happen with the gold market. Long GDX (10/9/20 at 40.78).
Tim Ord,
Editor
www.ord-oracle.com. New Book release "The Secret Science of Price and Volume" by Timothy Ord, buy at www.Amazon.com.