
SPX Monitoring Purposes: Sold long 4/9/21 SPX at 4128.80= gain 6.16%; Long SPX on 3/24/21 at 3889.14.
Monitoring Purposes GOLD: Long GDX on 10/9/20 at 40.78.
Long Term SPX Monitor Purposes: Sold long SPX on 1/15/21 at 3768.25= gain 10.80%; Long SPX on 10/26/20 at 3400.97.
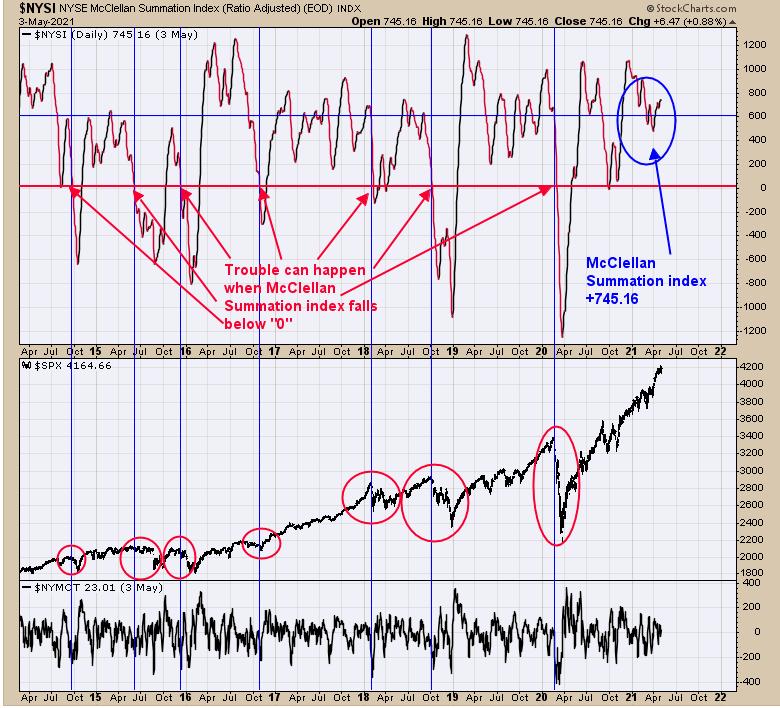
Investors may be wondering if this is the start of a larger decline; according to the chart above, the answer is no. The top window is the NYSE Summation index. Markets weaken first before a large decline begins. The weakness comes in the form of the Advance/Decline, which is the components of the Summation index above. Large declines can begin when the McClellan Summation index falls below "0" (noted with blue vertical lines). Current McClellan Summation index stands at +745 and in a relatively strong position. It's possible to see a 5% or less short term correction here, but a 10% or more correction is unlikely.
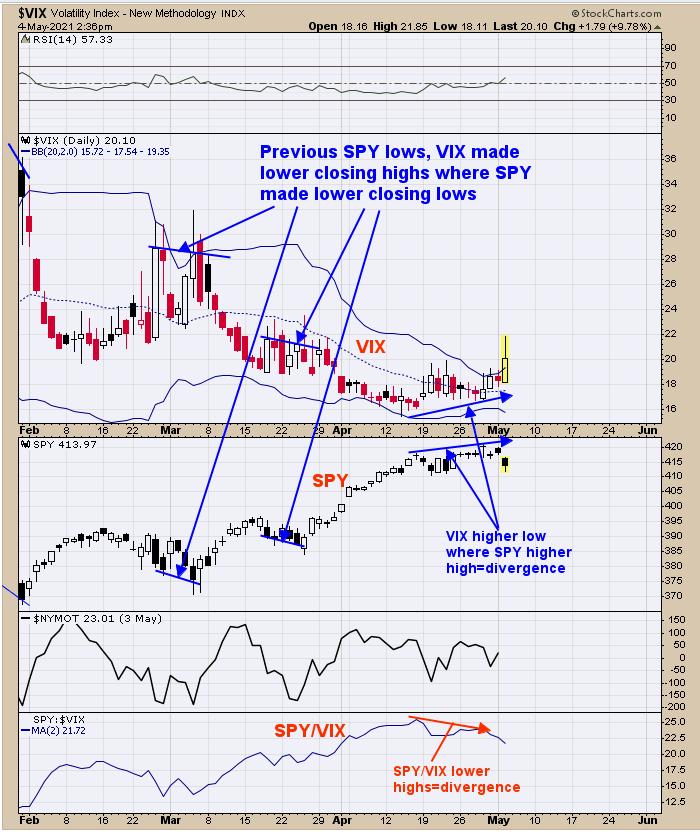
Yesterday we said, "Since mid-April, the SPY has made higher highs and the VIX has made higher lows, which is a short-term divergence. The bottom window shows this divergence more clearly, which is the SPY/VIX ratio. When this ratio is moving higher, then everything is in sync and a bullish sign for the market. The SPY/VIX ratio peaked in mid-April and has modestly moved lower, a bearish short term sign." As of today, this ratio is still moving down and remains short-term bearish. We noticed that, at previous important lows, the SPY will make lower lows and the VIX will make lower highs, which are a positive divergence (see early and late March VIX divergence on chart above). This same setup may develop on the next low in the SPY (SPX). There is support on the SPY near the 410 level, which is the mid-April low. If panic develops in the area, a bullish setup could be triggered. Staying patient for now.
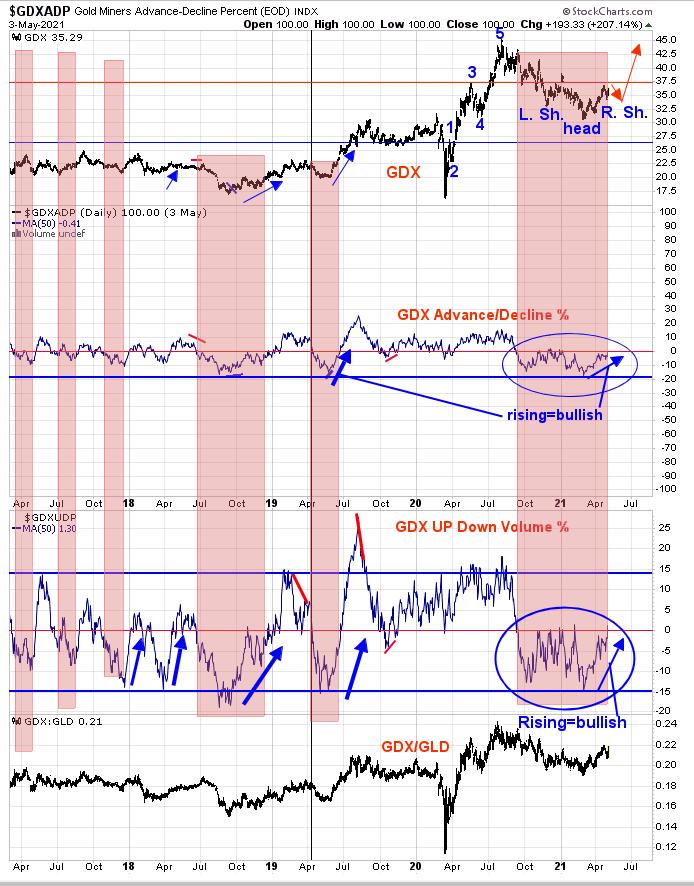
The chart above looks into the strength for GDX. The second window up from the bottom is the Up Down volume for GDX with a 50-day average. We shaded light pink when it's below "0" and when price are usually declining. This indicator has been below "0" since last August. A bullish sign is present, though, as the Up Down Volume indicator has been rising since the March low. To get back to totally bullish, this indicator needs to close and hold above 0. The next window up is the Advance/Decline with a 50 day average, which works the same was as the Up Down Volume indicator. It too has been rising since the March low and is near the 0 level now. Seasonality-wise, May is not a good month for Gold and Gold stocks. What could be forming here is a head-and-shoulders bottom pattern where the head is the March low. In the next 30 days or so, the right shoulder may form and, when the neckline of this potential head-and-shoulders bottom is exceeded, that is when the Up Down Volume and Advance/Decline indictors break and hold above 0. The bigger picture is bullish, but there is a chance of a sideways pattern this month. Long GDX (10/9/20 at 40.78).
Tim Ord,
Editor
www.ord-oracle.com. New Book release "The Secret Science of Price and Volume" by Timothy Ord, buy at www.Amazon.com.