
SPX Monitoring Purposes: Long 7/23/21 SPX 4411.79
Monitoring Purposes GOLD: Long GDX on 10/9/20 at 40.78.
Long Term SPX Monitor Purposes: Neutral
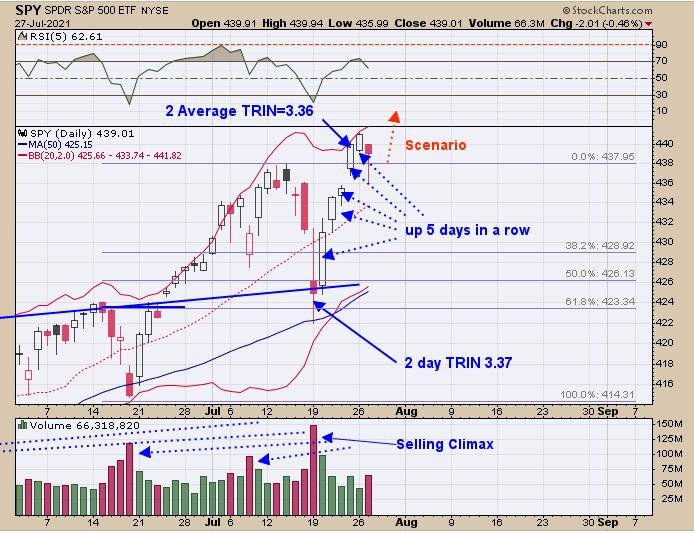
The FOMC meeting announcement is tomorrow around 2:00 Eastern Time and could see a gyration around that time. However, the market should end the week on a positive note. On Friday, the 2-day TRIN closed at 3.36, which is a bullish sign short-term. The SPY was up five days in a row going into yesterday and the market is higher within five days 84% of the time. Not sure what tomorrow will bring (FOMC announcement) but, by Friday, the market may hit new highs. Seasonality wise, going into a new month usually leans bullish and Friday marks the end of July trading. Seasonality for the month of August leans bearish, so, when the current rally ends, the market may flip sideways.
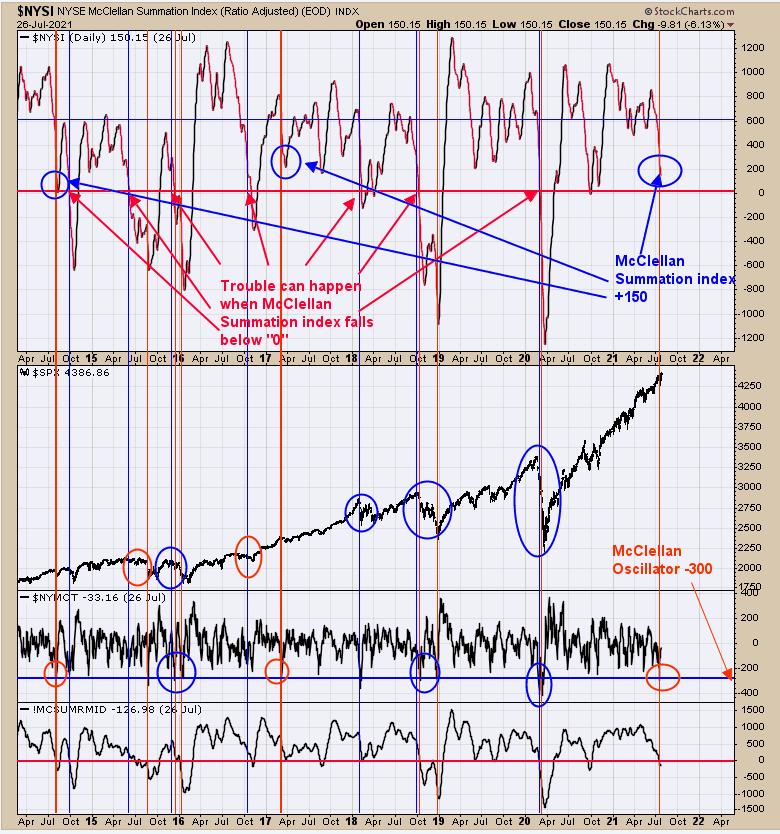
Back on July 20, we said, "We don't think a large decline is beginning here. Large declines can occur when the NYSE McClellan Summation index falls below '0' and the current close is +273.91. The second window up from the bottom is the NYSE McClellan Oscillator. We marked all cases going back to 2014 with red and blue vertical lines, when the Oscillator fell below -300 (yesterday's was -300.13). The blue circles times show when the McClellan Oscillator closed below minus 300 and the McClellan Summation index was below 0 (which marked the big declines). The red circles marked the times when the Oscillator hit below -300 but the Summation was above 0; these times mark relative mild declines. A big decline can come later, but the market is not set up for a large decline here as the Summation index is far above 0." We updated the chart to yesterday's close and the McClellan Summation index stands at +150, still above 0.
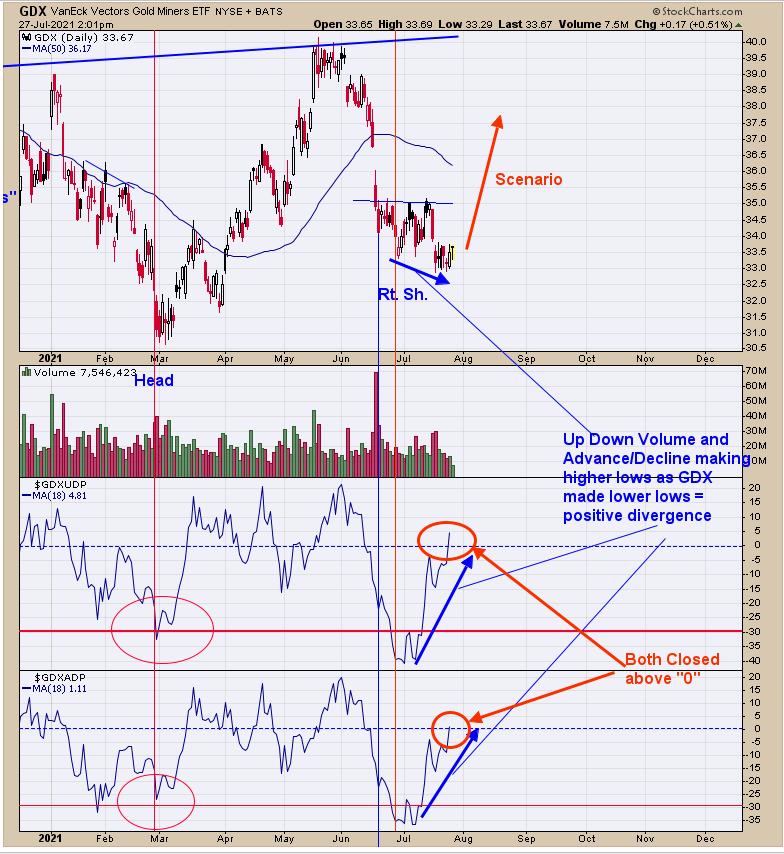
Last Thursday, we said, "The bottom window is the GDX Advance/Decline with 18-MA and next window up is the GDX Up down volume with 18-MA. Readings below -30 on both indicators have led to intermediate-term lows for GDX. In some cases, the market moved sideways for a spell before heading higher. Over the last couple of weeks, GDX has made minor new short-term lows while Advance/Decline and Up Down volume indicators moved higher which in the past has been a positive divergence. It appears GDX is at a low here and either market moves sideways a while longer before moving higher or rally starts now." Add to the above commentary, both Up Down Volume and Advance/Decline indicators closed above 0, suggesting the rally in GDX has started. There is evidence that the right shoulder of a Head-and-Shoulders bottom is forming on GDX and the low on the Right Shoulder may have been seen.
Tim Ord,
Editor
www.ord-oracle.com. New Book release "The Secret Science of Price and Volume" by Timothy Ord, buy at www.Amazon.com.