
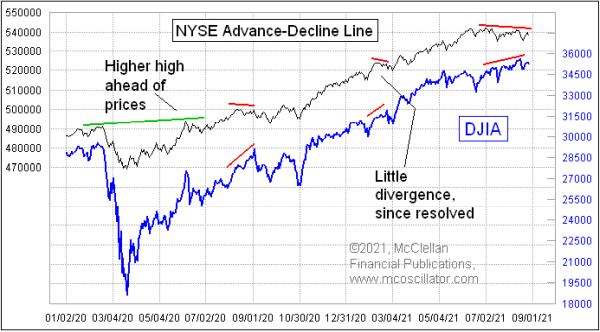
When last I wrote here about the NYSE Advance-Decline (A-D) Line in March 2021, there had just been a little divergence, which had resolved itself by the A-D Line moving to a higher high. That's one of the points about such divergences; they can be rehabilitated, and, when they are, that is a really bullish sign.
Now, we are seeing another bearish divergence that has developed at the right end of the chart; so far, this one has not yet been rehabilitated. It still could be, but, for the moment, it is a problem for the market to have higher price highs that are still unconfirmed by the A-D Line. And this comes in tandem with last week's article about a similar-looking divergence in the behavior of the stocks that make up the Nasdaq 100 Index.
Watching the A-D Line is important because it can give us hints about problems with financial market liquidity ahead of those problems affecting the big-cap stocks. Everyone knows that indices like the S&P 500 are dominated by a handful of really big capitalization stocks. But the smaller ones fight for liquidity in the same market, and they are often the first ones to suffer when liquidity starts to dry up.
It is the same principle as the canaries that used to be used in coal mines a couple of centuries ago. These small birds were more sensitive to the presence of toxic gases, and so if the canaries keeled over, then the big burly coal miners needed to get themselves out of the mine before they succumbed.
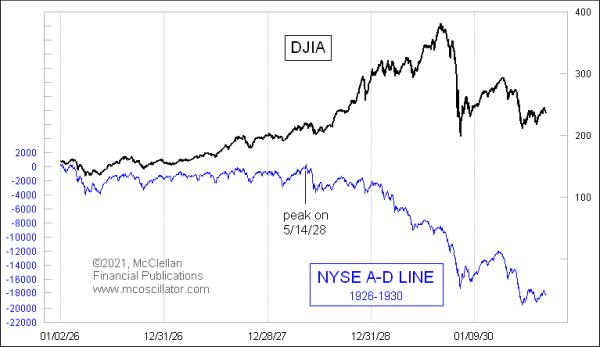
The first analysts to study the A-D data in depth were Leonard Ayres and James Hughes of the Cleveland Trust Company. They wondered starting in 1926 what it meant to have more or fewer stocks going up or down each day, so they started gathering the data. If only chartists could have known about the concept of an A-D Line divergence back in the late 1920s, perhaps there could have been better warnings ahead of the 1929 crash.
We saw A-D Line divergences that were important in the 2000s, although not as much as the 1929 example. At the big October 2007 price top, the A-D Line was already in a downtrend, having topped out 4 months before. That was a pretty ominous warning of trouble, and it was right.

In the current time frame, it is still possible that the A-D numbers could improve and produce a rehabilitated divergence. That is possible, and I will be on the lookout for it. For now, though, it is giving us a big warning of trouble, saying that, in spite of the Fed still buying $120 billion a month of bonds, liquidity is starting to dry up. Just imagine what will happen if/when the Fed starts its taper.