
SPX Monitoring Purposes: Long SPX on 11/1/21 at 4610.62.
Monitoring Purposes GOLD: Long GDX on 10/9/20 at 40.78.
Long Term SPX Monitor Purposes: Neutral.
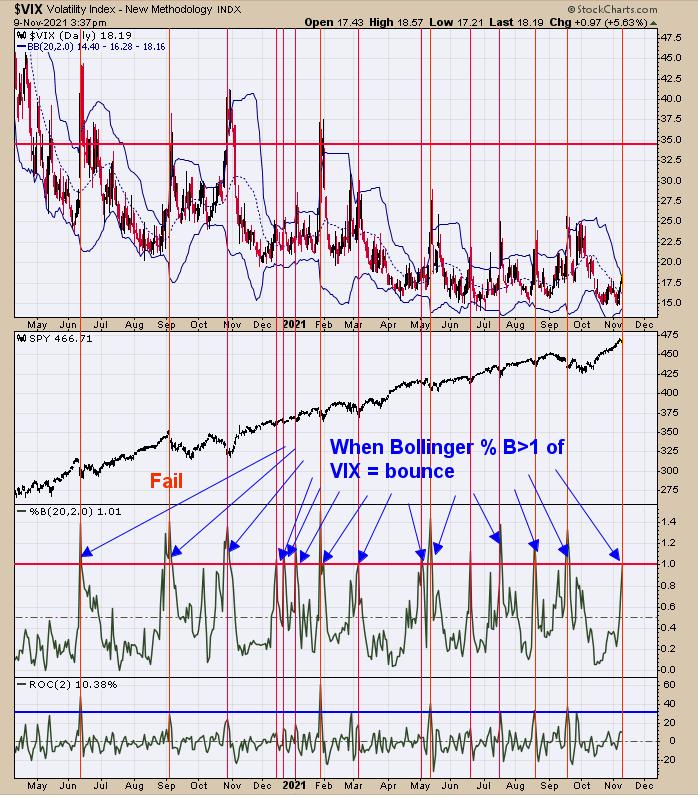
SPY was up 8 days in a row going into yesterday, a pattern which predicts the market will be higher within 5 days 93% of the time. The chart above gives evidence that market bounce is near. When the Bollinger Band percent B of the VIX is great than 1.00 (current reading is 1.01), the market is near an area where a bounce is likely. The chart goes back about 1 ½ years and shows the times when the "percent B" of the VIX was >1.00 (noted with blue arrows). This happened 14 times in the last 1 ½ years; 13 times, the market was near a short-term low for a probability being higher 93% of the time. A clue that the SPY may be near a worthwhile high is when the TICK closes above +400, ideally a couple of days in a row and something to watch if market does breaks to new highs going into option expiration week. We remain long the SPX.
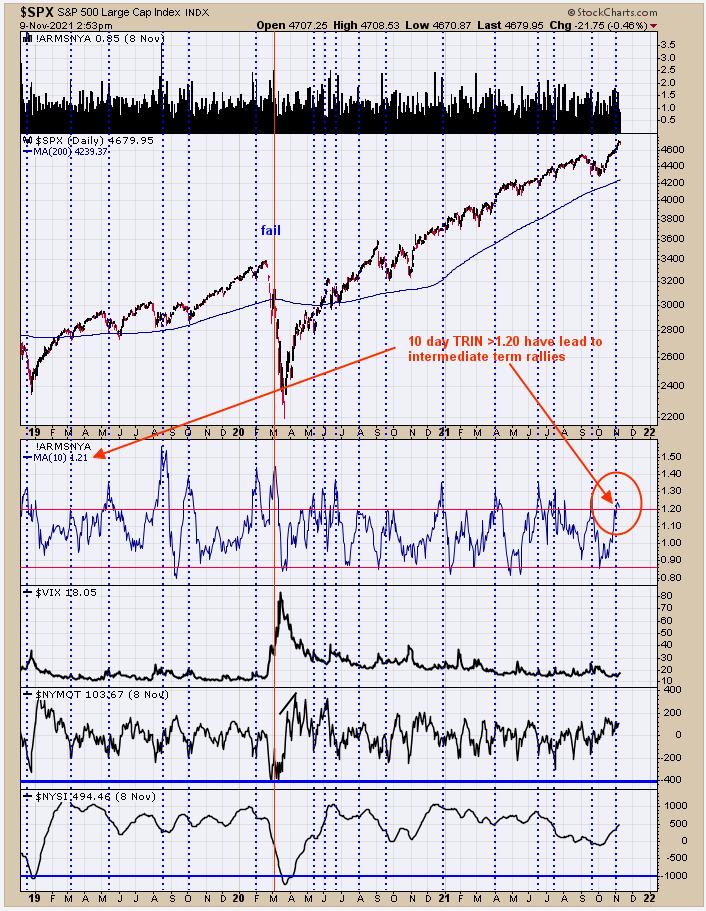
We updated this chart from yesterday, when we said "The fourth window up from the bottom is the 10-day average of TRIN. This chart goes back to 2019 and shows the times when the 10-day TRIN reached 1.20 or higher, identified with blue dotted lines (current reading is 1.23). Usually the 10 TRIN will drop below 1.00 or lower before a top is identified. The 10-day TRIN is staying in the bullish level, suggesting there is enough panic for it to go higher. Though there could be a pullback here, it should be minor. It looks as though the week of option expiration week, where the market may find trouble (starting from a week from today)." The 10-day TRIN now stands at 1.21 and remains bullish. SPY was up 8 days in a row going into yesterday, which predicts the market will be higher within 5 days 93% of the time. If market is higher within 5 days and 10-day TRIN falls below 1.00, it could be time for a larger consolidation.
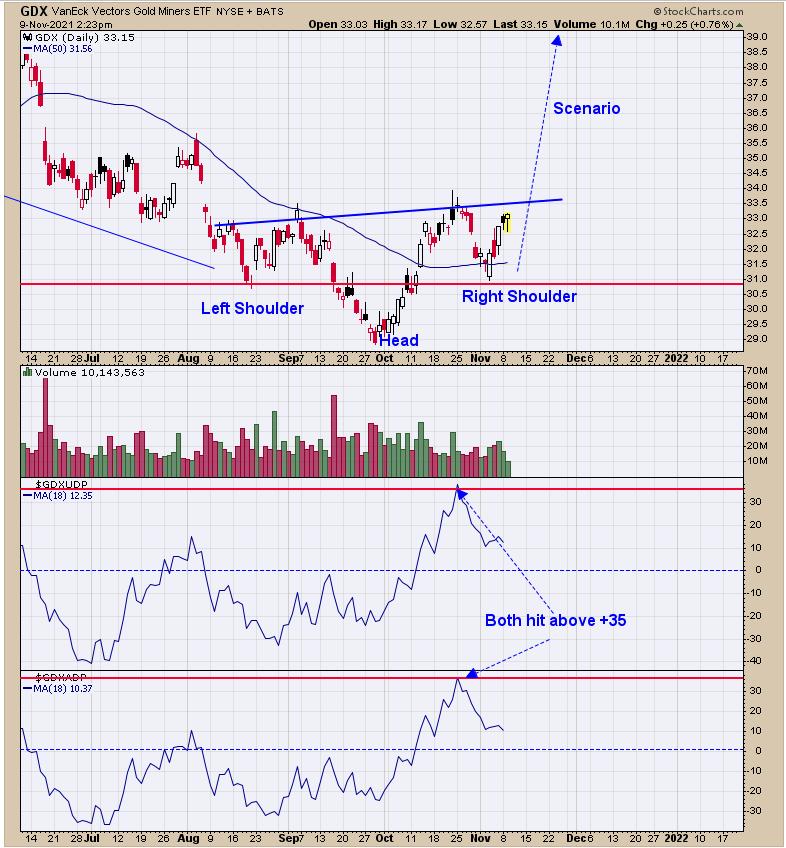
We updated this chart from yesterday, when we said, "The Head and Shoulders bottom pattern on GDX appears to be working out. Back in late October, both the 18-day averages of the Up Down Volume percent and Advance/Decline percent reached above +35, suggesting initiation of an uptrend. The Neckline lies near 34.00 and, to confirm this potential Head-and-Shoulders bottom, GDX should see a "Sign of Strength" through the 34.00 level. This potential Head-and-Shoulders bottom has a measured target near 39.00 and the May high comes in 40.00 and is the first upside target. What happens at the 40.00 range (if we get there) will determine what will come next. The picture so far looks bullish for the short term." Momentum like this off a bottom on both 18-day averages for the Up Down Volume and Advance/Decline indictors is a good sign for short-term higher prices on GDX. We will be watching this chart closely in the coming weeks for additional signs of strength.
Tim Ord,
Editor
www.ord-oracle.com. New Book release "The Secret Science of Price and Volume" by Timothy Ord, buy at www.Amazon.com.