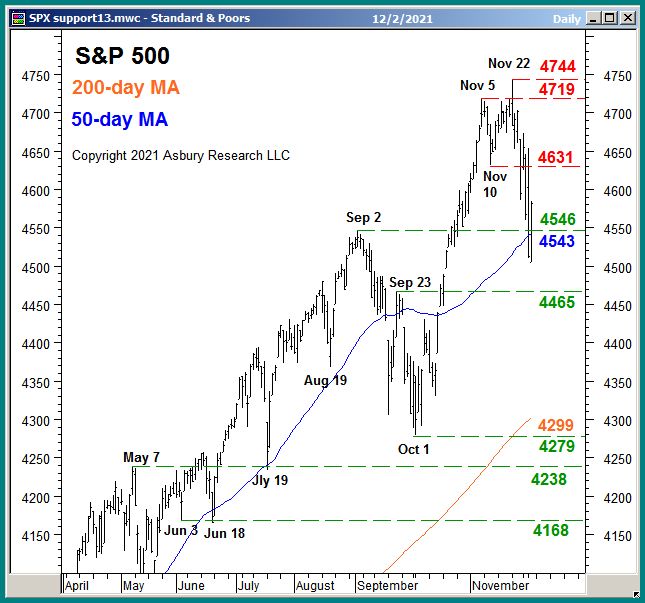
This has been quite a year for the S&P 500 (SPX). The US benchmark index has been up by as much as 26.3% for the year at its November 22nd highs — and has risen by an unbelievable 116.4% from the March 2020 COVID-19 lows. This year, the S&P 500 has been characterized by a very strong "buy the dip" mentality: that is, whenever the index declines to its 50-day moving average, you just buy it. And, thus far, this strategy has been extremely successful. The 50-day moving average in the S&P 500 has been tested 10 times this year, including the test that's taking place right now as shown in Chart 1 below, and eight of them have triggered the resumption of the larger bullish trend. In fact, the biggest decline from any minor peak that SPX has had all year has been 5.2%. On the surface, that seems like a pretty calm market, and an easy year to invest.
But, below the surface, 92% of the S&P 500's constituent stocks have had at least a 10% decline, with the average decline being 19%. This means, like a duck on the water, the part that we can easily see looks calm and sedate while there is frantic churning going on below the surface.
In a market that has been trained all year long to "buy the dip", how do we know if this is just another minor pullback — and a new buying opportunity into the traditional Santa Claus Rally — or the start of a real (and very overdue) corrective decline?
The following three metrics are what we are watching at my firm, Asbury Research, as critical "under the hood" metrics to make this important determination.
#1: Market Internals
The table below displays our Asbury 6 risk management model. The "A6" consists of six diverse market metrics that we have combined to look beyond the day-to-day, up-and-down noise of the stock market to determine its actual health — in much the same way as a doctor first checks the patient's vital signs during an office visit. It helps us to identify real, sustainable market advances or declines from computer-driven traps for investors — the latter of which are often generated by algorithmic (computerized) trading.
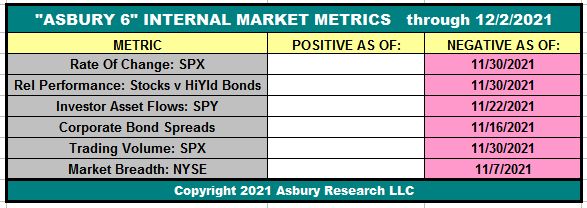
The table displays the current status of the Asbury 6 through the close on December 2nd, which is Negative, or bearish. The model has been on a Negative status since November 30th, from a Positive one on October 14th. Four or more metrics in one direction, either Positive (green) or Negative (red), indicate a tactical bias. The dates in each cell indicate when each individual constituent of the A6 turned either positive (green) or negative (red).
Until four of the six constituent metrics turn back to green or positive, the model's bias will remain Negative — warning that the US stock market is vulnerable to a deeper decline.
#2: Market Volatility
The lower panel of Chart 2 below plots the CBOE Volatility Index, better known as the VIX, daily since May with its 21-day moving average, the latter which indicates the monthly trend. A rising VIX indicates increasing investor fear. A declining VIX indicates investor complacency. The upper panel displays a corresponding chart of the S&P 500.
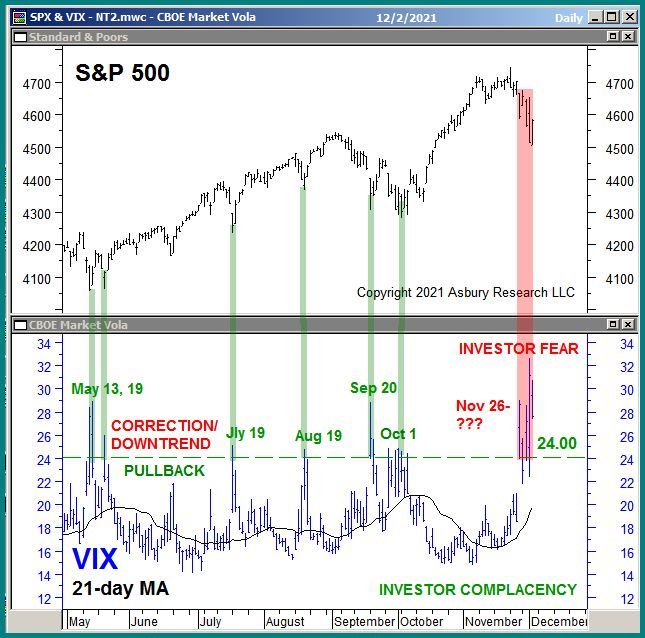
The green highlights show that 6 previous rises to and quick declines from a 24.00 or higher reading in the VIX coincided with the past 6 near-term bottoms in the S&P 500. The rightmost red highlights, however, show that the VIX has now been above 24.00 for the past six sessions. We are closely watching 24.00 in the VIX as a line of demarcation between a market pullback, during which the VIX would quickly decline back below 24.00, or a correction in which the VIX would remain above 24.00. Right now, recent movement in the VIX is signaling an emerging correction.
#3: Investor Asset Flows
Chart 3 below plots the S&P 500 daily since July in the upper panel, with a corresponding chart of the total net assets invested in the SPDR S&P 500 ETF Trust (SPY, which tracks the S&P 500) in the lower panel. Investor asset flows measure investor conviction in a price move. This data series measures monthly investor conviction, or the lack of it, in the US broad market via a 21-day (monthly) moving average.
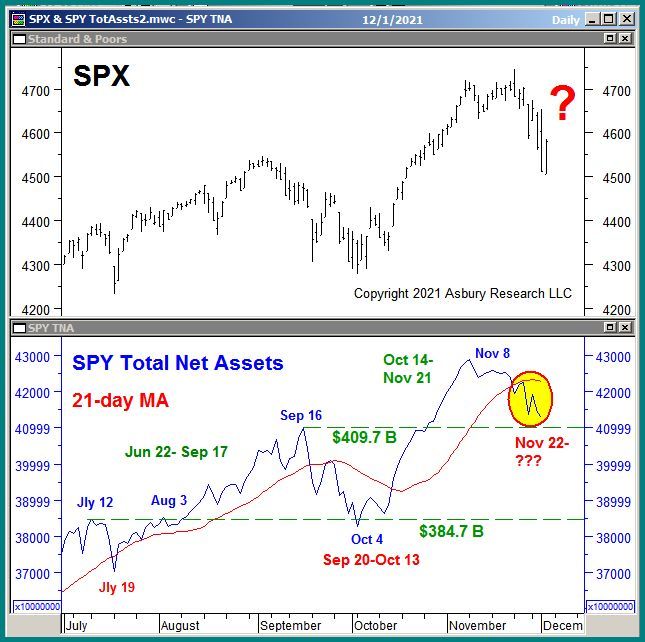
A quick look at the chart shows that periods of monthly asset expansion coincide with ("fuel" is a more accurate description) a rising S&P 500, and monthly asset contraction coincides with a declining SPX. The rightmost red highlights show that these assets have been in a trend of monthly contraction since Nov. 22nd, which is negative for the market.
It would take a shift back to a trend of monthly expansion in these assets, as most recently occurred between Oct. 14th and Nov. 21st, to indicate that enough bullish conviction has returned to the marketplace to support the resumption of the S&P 500's larger 2021 advance.
Conclusion
The benchmark S&P 500 is currently testing its 50-day moving average as underlying support, a level that has already triggered a "buy the dip" response from investors eight times this year. The next significant directional price move in the US broad market average, either up or down, is likely to begin from this tactical inflection point. This time, however, weak market internals, elevated market volatility and contracting investor asset flows warn that "buy the dip" will not work, and the US stock market will slip into an overdue and potentially nasty corrective decline.
Sign up for Asbury Research's free Bi-Weekly Stock Market Update by Clicking Here. Learn more about our investment management approach by Clicking Here.
John
John Kosar, CMT
Chief Market Strategist, Asbury Research