
SPX Monitoring Purposes: Covered 1/24/22 open 4356.32=7.57%; Short SPX 1/11/22 at 4713.07.
Monitoring Purposes GOLD: Long GDX on 10/9/20 at 40.78.
Long Term SPX Monitor Purposes: Neutral.
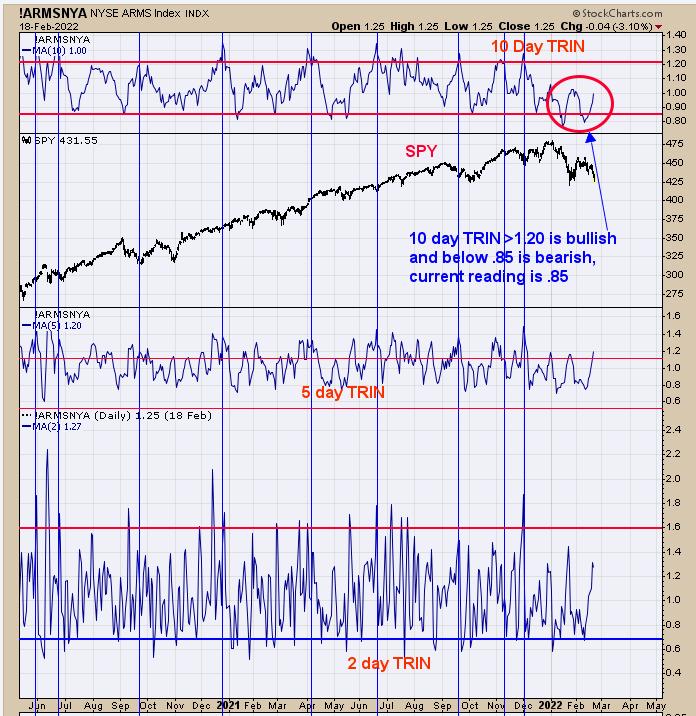
Panic forms at bottoms of markets. TRIN (along with VIX and TICKS) helps to define when panic arrives. The market has been down a decent amount over the last month and the 10-day TRIN, which helps to define the bigger timeframes where panic is present. Intermediate-term lows form when the 10-day average of the TRIN reaches above 1.20; the current reading stands at 1.00. The market may be close to a low, but, according to the 10-day TRIN, panic has not reached levels where a worthwhile low has formed. This condition can change quickly if TRIN rises in the next few days. Being patient for now.
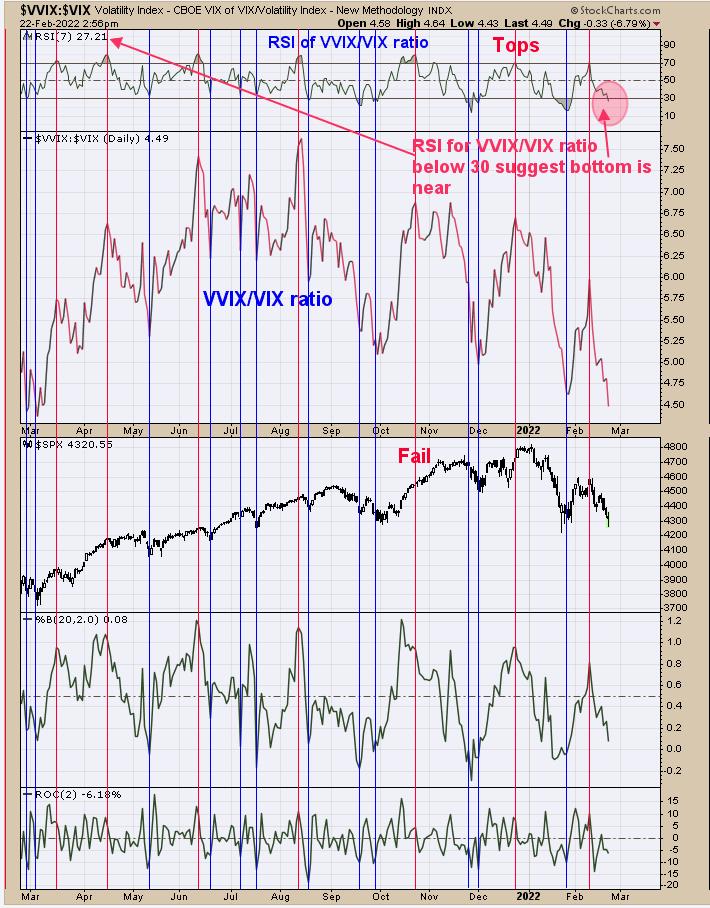
The top window is the RSI for the VVIX/VIX ratio (which is the next window down). RSI readings below 30 for this ratio suggest a bottom is nearing. Right now, the RSI is 27.21, but could fall further below 30 before the bottom is in. The red vertical lines show the times when the RSI of this ratio is above 70, suggesting a short-term top and the blue vertical lines shows the times when RSI was below 30, suggesting a bottom is near. VVIX/VIX RSI readings is an indicator that helps to define greed and fear.
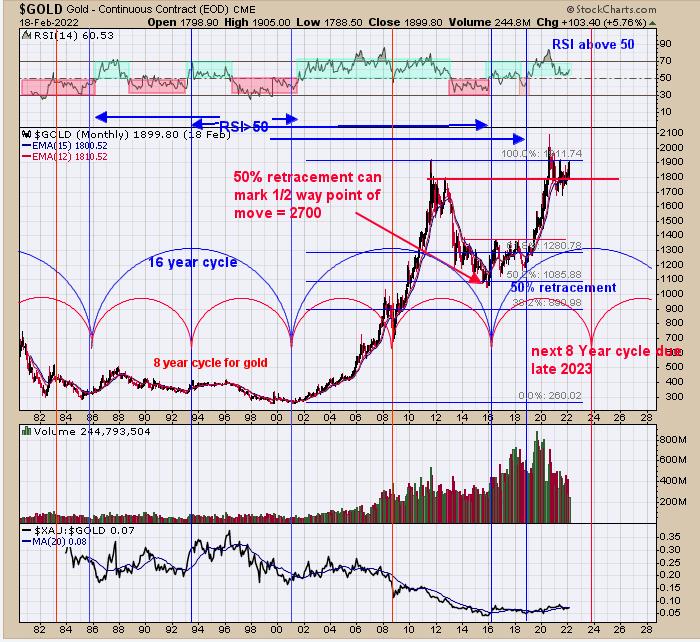
Above is the monthly gold chart going back to mid-1981. We have shown this chart in the past; it's now updated to current data. We have labeled the 16- and 8-year cycles on this chart. Both cycles bottom in 2016. The 8-year cycle is due to bottom at the end of 2023 or early 2024, so there is plenty of time for the gold market rally. The top window is the monthly RSI for gold, which is closed at 60.53. RSI readings above 50 show the gold market is in a bull phase and below 50 a bear phase. RSI has been above 50 since late 2018. From the low in 2001 to a high in 2011, gold retraced 50% of that rally going into a low in 2016. A 50% retracement of a previous rally marks the halfway point of the move up, which would give a target near 2700 for Gold. Counting the low in 2016, the "Head" (1100 range) and the "Left Shoulder" being 2011 consolidation and the "Right Shoulder" finishing up now would put the "Neckline" near 2000 on gold. The difference from the bottom of "Head" to the "Neckline" is 900 points; adding that to the Neckline would give a target near 2900 for Gold. Should be a lot more fun in the gold market in the coming months than it was in the past 1.5 years.
Tim Ord,
Editor
www.ord-oracle.com. New Book release "The Secret Science of Price and Volume" by Timothy Ord, buy at www.Amazon.com.