
SPX Monitoring Purposes: Long SPX on 2/23/22 at 4225.50.
Monitoring Purposes GOLD: Long GDX on 10/9/20 at 40.78.
Long Term SPX Monitor Purposes: Neutral.
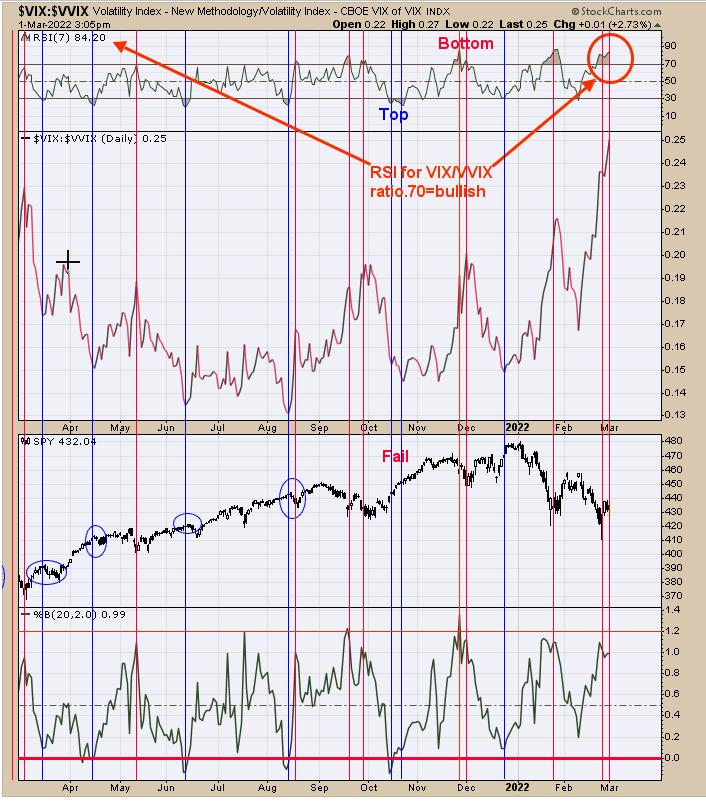
The SPX has been consolidating for the last couple of days. The above chart is the VIX/VVIX ratio with its RSI (7) in the top window. Lows in the SPX have been found when the RSI for VIX/VVIX ratio is above 70 (currently 84.20). The red vertical lines on chart above show the times when RSI on this ratio was above 70. According to this indicator, the current consolidation is near an end and the rally that began on 2/24 should continue. Long SPX on 2/23/22 at 4225.50.
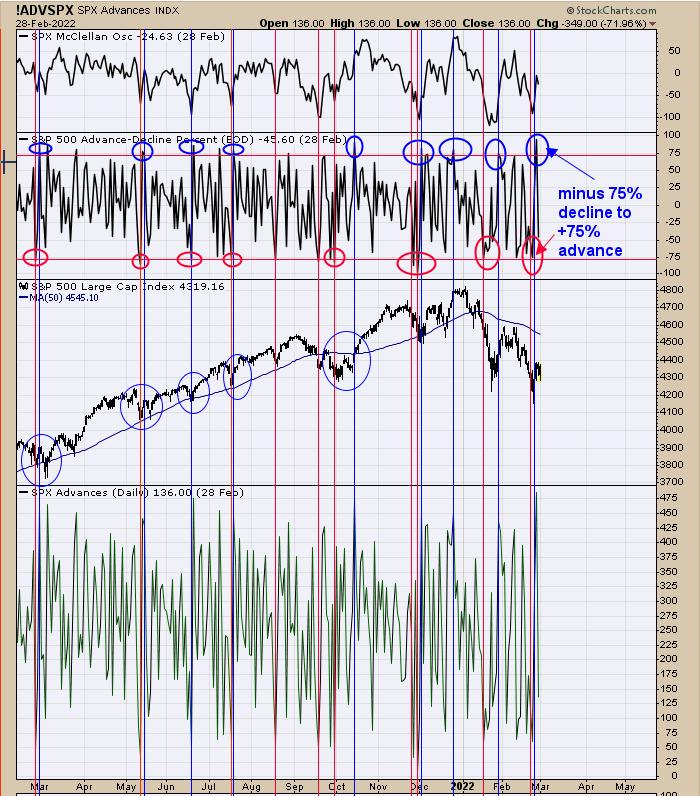
We updated this chart from yesterday, when we said "On Friday, 94% of the stocks in the SPX advanced, which is a strong showing. The second window down from the top is an indicator that measures the percent of stocks in the SPX that have advanced or declined in a day. It's a bullish sign for the SPX when the percent of stocks reach below 75% that decline, then reverse and show 75% of the stocks advance. Friday reached 94% that advanced. We showed with red lines on the chart above that 75% stocks fell in the SPX and the blue lines show when 75% of the stocks advanced. This situation occurs when markets have reversed from down to up." Yesterday and today's pullback seem to be a normal consolidation pattern and, once it ends, the market should head higher.
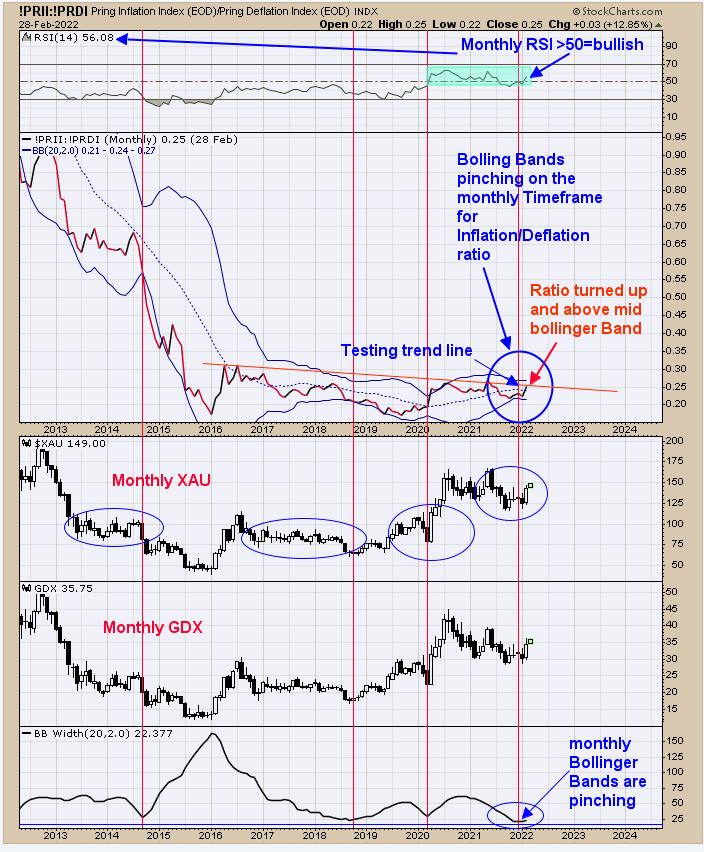
The monthly charts rule the weekly charts and weekly chart rule the dailies. Above is the monthly Inflation/Deflation ratio. The monthly Bollinger Bands are pinching (bottom window) this ratio, which suggests the narrow range in this ratio is near an end and an impulse wave is above to begin. The top window is the monthly RSI for this ratio, which is at 56. An RSI reading above 50 suggests the trend is up and, in turn, suggests the impulse wave will be up for the for this ratio. This ratio stands at .25 and the mid-Bollinger Band closed at .24 and, therefore, the ratio is above the monthly mid-Bollinger Band, showing that the ratio is in an uptrend. We drew a red trend line connecting the highs on this ratio going back to 2016. Ideally one would expect a "Sign of Strength" through this trend line in the coming weeks to confirm a breakout. With all this going on, energy to the upside should increase on this ratio. Monthly momentum indicators have turned up, suggesting the rally's phase is in the early stages and momentum rules all indicators.
Tim Ord,
Editor
www.ord-oracle.com. New Book release "The Secret Science of Price and Volume" by Timothy Ord, buy at www.Amazon.com.