
I want to introduce you to a really old indicator created a few decades ago, but which still has relevance today.
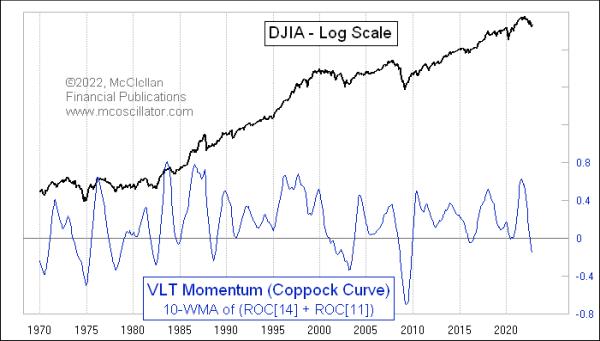
This week's chart shows an indicator that technical analysts for years have referred to as the "Coppock Curve". Developed years ago by the late E.S.C. Coppock, who called it his "Very Long Term (VLT) Momentum indicator," this is a super-slow and super-long term indicator. Its purpose is to pick out the really juicy long term bottoms, i.e. when it shows a deeply negative reading and, importantly, when it turns up.
Coppock had been a money manager and did some work managing assets for the Episcopal Church in the U.S. As part of that, he had a discussion with a priest about the grieving process, and the priest asserted that it takes a person 11 to 14 months to grieve over the loss of a loved one. Coppock concluded that the process of getting over a big loss on an investment might work the same way in terms of human psychology, and so he incorporated that timeframe into his indicator. What he wanted was a way to identify the really important long-term buying opportunities.
To calculate his VLT Momentum indicator, Coppock employed two rate of change calculations -- 11 and 14 months. That just means where is the DJIA today versus 11 months ago and versus 14 months ago, expressed in percentage change terms. Those two numbers get added together. Then, Mr. Coppock employed a 10-month "weighted moving average" or WMA, which weights the more recent data more heavily. What that means is the current reading for the 11ROC + 14ROC gets a weighting of 10, last month's gets a weighting of 9, the month before that is 8, and so on...
The chart above shows that the current reading is the lowest since the 2007-09 bear market, but this longer term look shows us that the Coppock Curve is still far from showing us one of those really historic bottoming indications. We are not guaranteed to get one of those; the market actually could turn up now, and turn up the Coppock Curve before it reaches another one of those juicy oversold lows. But such an upturn is going to be hard to accomplish from the current price level for the DJIA.
With a little bit of algebra, it is possible to calculate the price level each month, which would result in a reversal for the Coppock Curve. I will spare you all of that math. It is similar to the Price Oscillator Unchanged level for the McClellan Price Oscillator that my parents created in 1969 alongside the McClellan A-D Oscillator.
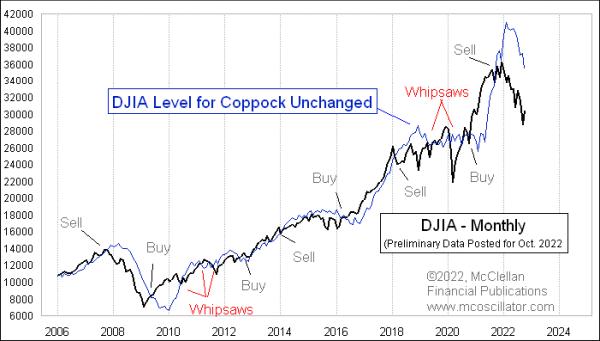
The lower chart shows this Coppock Unchanged plot compared to the DJIA. If the DJIA were to close exactly on that level, then the Coppock Curve would be unchanged and would move sideways. When the DJIA's plot crosses that blue line, the Coppock Curve changes direction. Like any trend-following indication, this one is subject to its share of whipsaws, so it can suffer in a sideways market. But that is not its purpose anyway. It was created to identify big juicy longer-term bottoming situations.
The Coppock Unchanged value is currently at 35,501.91 for the DJIA as of the end of October 2022, which is more than 5,000 points away. In other words, to turn up the Coppock Curve at the end of October, the DJIA would need to close above that 35,501.91 value. But the Coppock Unchanged number is dropping at a rate of about 1700 points per month, so a crossing above that line gets easier as each monthly close goes by. When the DJIA finally crosses that Coppock Unchanged line, the Coppock Curve will turn up, and we will at that point have a super-long term buy signal from this indicator.