
SPX Monitoring Purposes: Long SPX on 10/10/22 at 3612.39.
Monitoring Purposes GOLD: Long GDX on 10/9/20 at 40.78.
Long Term SPX Monitor Purposes: Neutral.
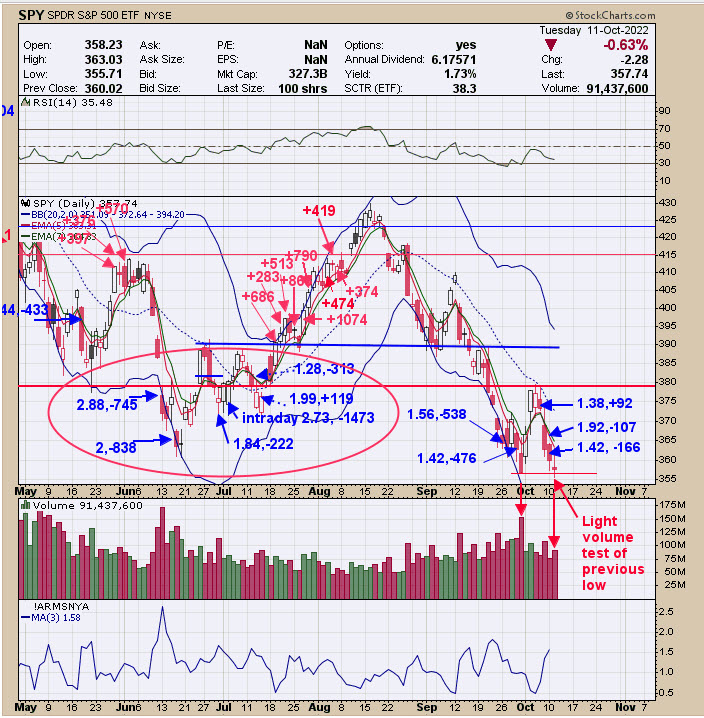
We updated this chart from yesterday, where we said, "The blue numbers next to the candles are the TRIN close (first number) and TICK close (the second number). A TRIN close above 1.30 and a TICK close below -300 (within a day of a trin close above 1.30) have been a bullish sign short-term for the SPX (SPY). Notice that there are a lot of bullish TRIN and TICK readings around current levels, suggesting support. This is the week before option expiration week, where whipsaws are common. There could be backing and filling short-term, but panic readings are present on the TRIN and TICKm suggesting support near current prices." Added to above, today's traded tested the previous low of 9/30 on lighter volume and suggests support. The market should at least bounce from here, and the type of bounce will tell how strong the market is.
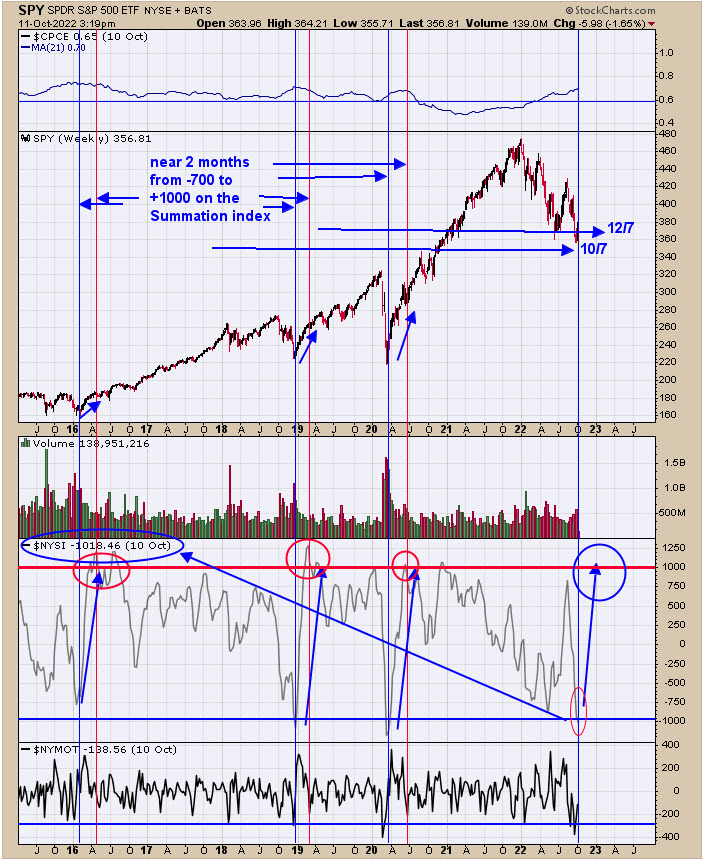
Yesterday, we said "The bottom window is the NYSE McClellan Oscillator; readings below -400 appear near intermediate term lows. On September 26, the McClellan Oscillator closed at -426. The next window up is the NYSE McClellan Summation Index. Intermediate-term lows have formed, with the Summation index closed below -700; Friday's reading came in at minus 974. SPX appears near a worthwhile low. The next rally will tell a lot what the underlying strength is. If the Summation index can get back to +1000 near December 7, that would bode well for the intermediate term. If the Summation index fails to reach +1000 by December 7, then, most likely, more work of back and filling or worse will be needed." We updated this chart to current data. The NYSE Summation Index closed yesterday at -1018 and well below -700, which suggests a sold-out market. -1000 is as low it usually gets.
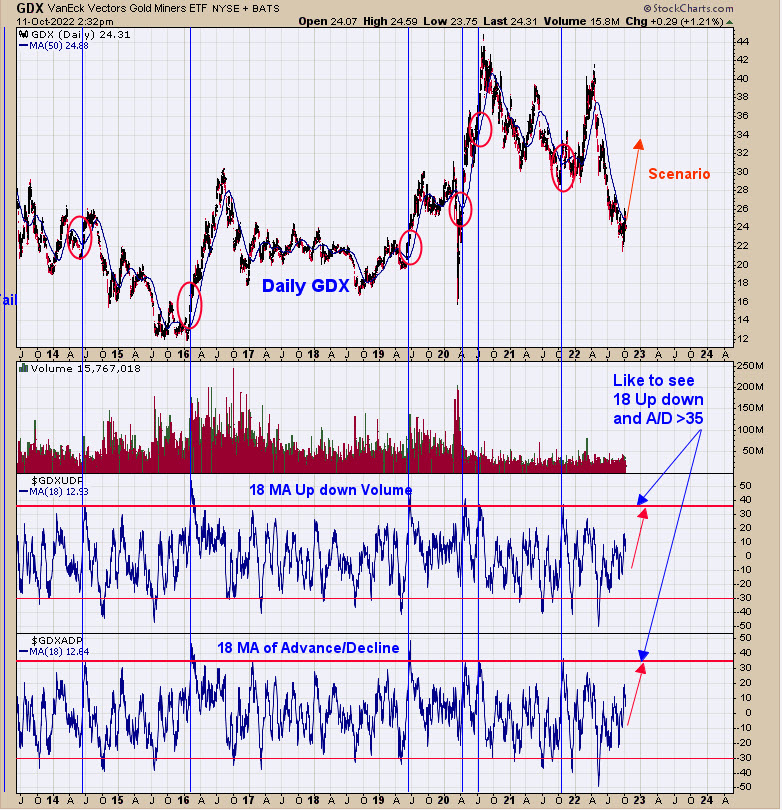
There is evidence from several different indicators that GDX (XAU and HUI) is making a low in this area. What we like to see now is a "Sign of Strength" (SOS) in GDX. One way for a SOS to appear is for both the 18-day averages of the Advance/Decline percent and Up Down Volume Percent (bottom two windows) to reach +35 ranges in the coming days. The previous times both indicators reached +35 (noted with red circles on GDX), the market went on to hit higher highs. The potential rally could lead to a long-term rise.
Tim Ord,
Editor
www.ord-oracle.com. Book release "The Secret Science of Price and Volume" by Timothy Ord, buy at www.Amazon.com.
Signals are provided as general information only and are not investment recommendations. You are responsible for your own investment decisions. Past performance does not guarantee future performance. Opinions are based on historical research and data believed reliable, there is no guarantee results will be profitable. Not responsible for errors or omissions. I may invest in the vehicles mentioned above.