The bears have missed out on a barn-burning rally over the last few weeks. Now, many are changing their stripes and "holding their noses" as they buy late into the rally. This is a great time to assess what's likely to happen next.
I've been bullish on this market for some time now and remain so. But, after a 15% increase in the S&P 500 index ($SPX) since the October 2022 bottom, I am now expecting a consolidation in stock prices. However, given the momentum and aggressive dip buying evident of late, we may not see any slowing until mid-February, unless the Fed derails the rally with bearish talk and bearish deeds.
With the number of bears who have missed the rally, the general technical improvement in the market will likely spur some more buying in the short term. But a lot depends on the Fed. Here are several reasons for the consolidation when it finally arrives:
- The market is overbought (RSI on the S&P 500 is hovering near 70);
- The upcoming Federal Reserve meeting has buzzkill potential; and
- Bullish January periods tend to be followed by sluggish February and March trading.
What happens next has to do with how inflation moderates and what the Fed says and does in response over the next few months, starting with its upcoming February 1 FOMC meeting, where expectations are for a 25-basis point increase in the Fed Funds rate. Moreover, if the Fed says it will pause to see if it needs to do more, we could see a final burst of upside in stocks. On the other hand, more tough talk from Chairman Powell could send the market into profit-taking mode.
No matter what the Fed says, however, any further data which suggests that inflation is slowing will likely put a floor under stocks. Hopefully, that floor will be above the key 200-day moving averages, as detailed below.
The most recent data, the Fed's PCE Deflator (Personal Consumption and Expenses), was a positive for stocks on January 27, 2023, as it only rose at a 4.4% annual clip, a nice slowing of its pace of rising. Unfortunately, it's still well ahead of the Fed's stated 2% inflation target.
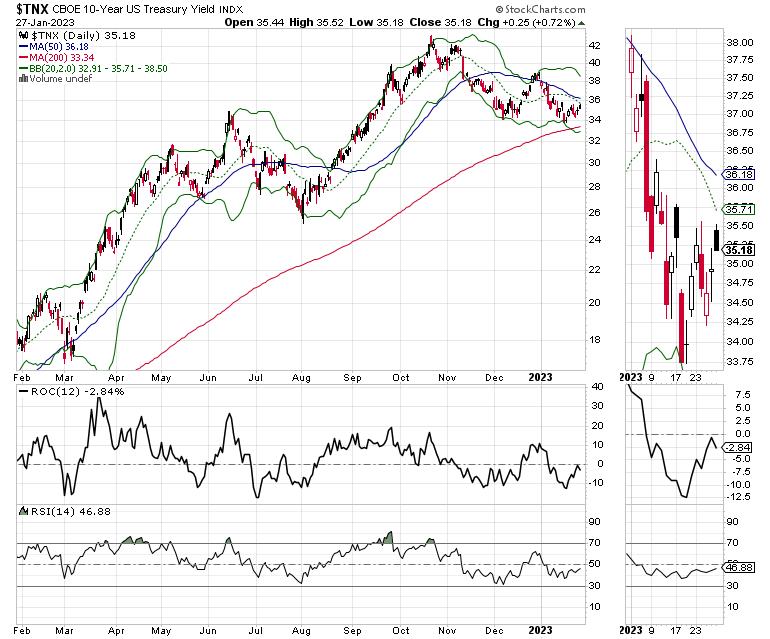
Bond yields are still circling around 3.5% while mortgage rates slid a bit further, with the average 30-year mortgage at 6.13%. These lower market interest rates are signaling a slowing in the economy, which, for now, is bullish for stocks, as long as the rate of slowing doesn't pick up and the jobs market, despite all the proposed layoffs, doesn't fall apart.
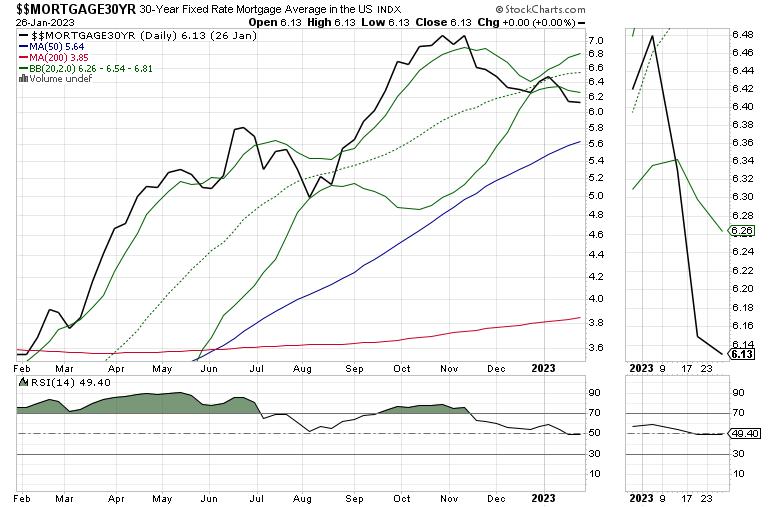
In another bullish development, lower mortgage rates may have put a floor under the housing market. In my neck of the woods, I'm seeing new construction pop up again, while houses that had not seen any potential buyers are starting to get some traffic.
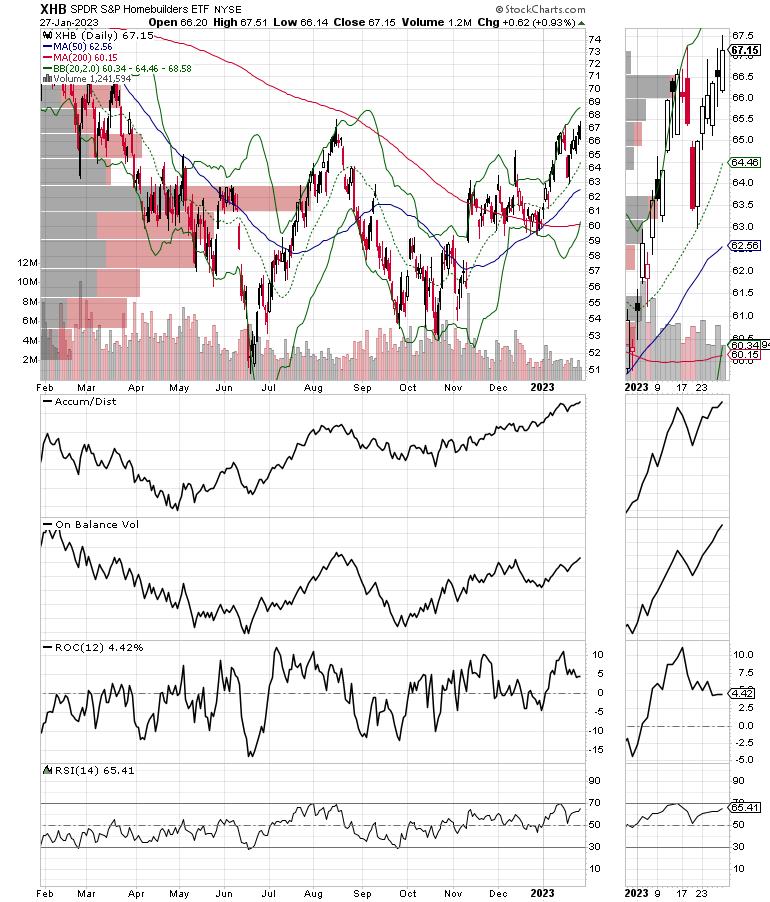
Still, bond yields and mortgage rates have slowed their rate of descent, as investors pause ahead of the Fed's upcoming rate decision and comments. For its part, the SPDR Homebuilders ETF (XHB) continues its momentum run, confirmed by a steady rise in accumulation distribution line (ADI) and on balance volume (OBV). This is about as bullish as it gets, as rising ADI means short sellers have given up and rising OBV means buyers are coming in. A move above $68 would likely unleash higher prices.
ETFs are great ways to invest in market sectors. But individual stocks often deliver more pop for the buck. In my subscriber portfolios, I have several housing stocks which are outperforming XHB. You can check them out with a free trial here.
Bullish Development: NDX Breaks Above 200-Day Moving Average Despite Intel Miss
The Nasdaq 100 Index ($NDX) did the unthinkable last week, as it moved handily above its 200-day moving average and the 12,000 area despite a big miss in former high-tech icon Intel (INTC). That's a clear sign that the uptrend in stocks, albeit in need of a rest, is picking up steam.

For its part, the New York Stock Exchange Advance-Decline line ($NYAD) remained steady in a rising trend above its 50-day and 200-day moving averages on January 6, 2023. This puts the stock market in an increasingly solid uptrend.
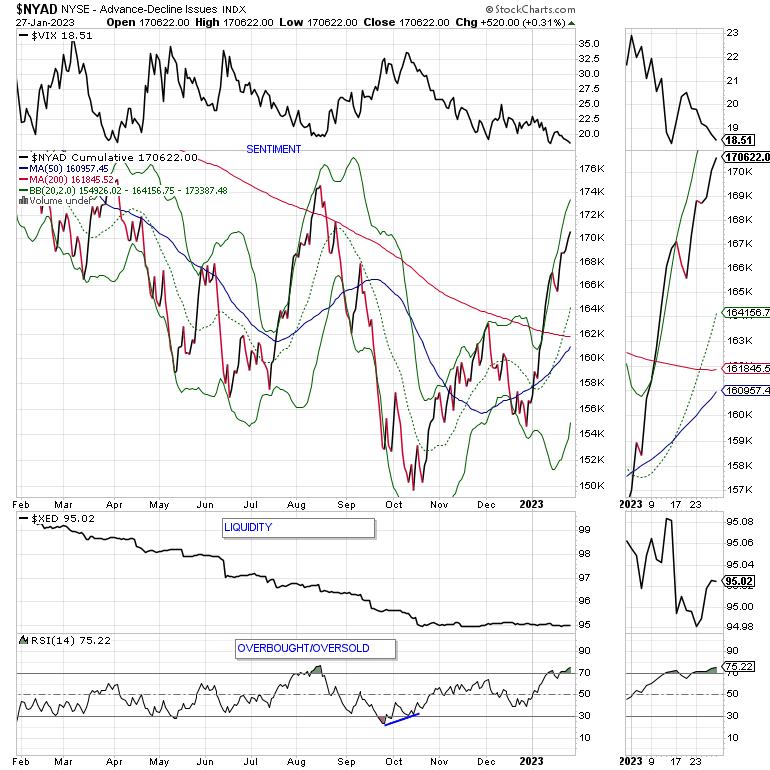
Meanwhile, the Cboe Volatility Index ($VIX) continues to make new lows, which is also bullish. When VIX rises, stocks tend to fall, as rising put volume is a sign that market makers are selling stock index futures in order to hedge their put sales to the public. A fall in VIX is bullish, as it means less put option buying, and it eventually leads to call buying, which causes market makers to hedge by buying stock index futures, raising the odds of higher stock prices.
Get all the details on why my favorite indicator, the NYAD, is bullish on the market right here.
Liquidity remains flat, which is better than when it's falling, as the Eurodollar Index ($XED) has been trending sideways to slightly higher for the past few weeks. Note the market's most recent rally, off of the October bottom, has corresponded to this flattening out in liquidity.
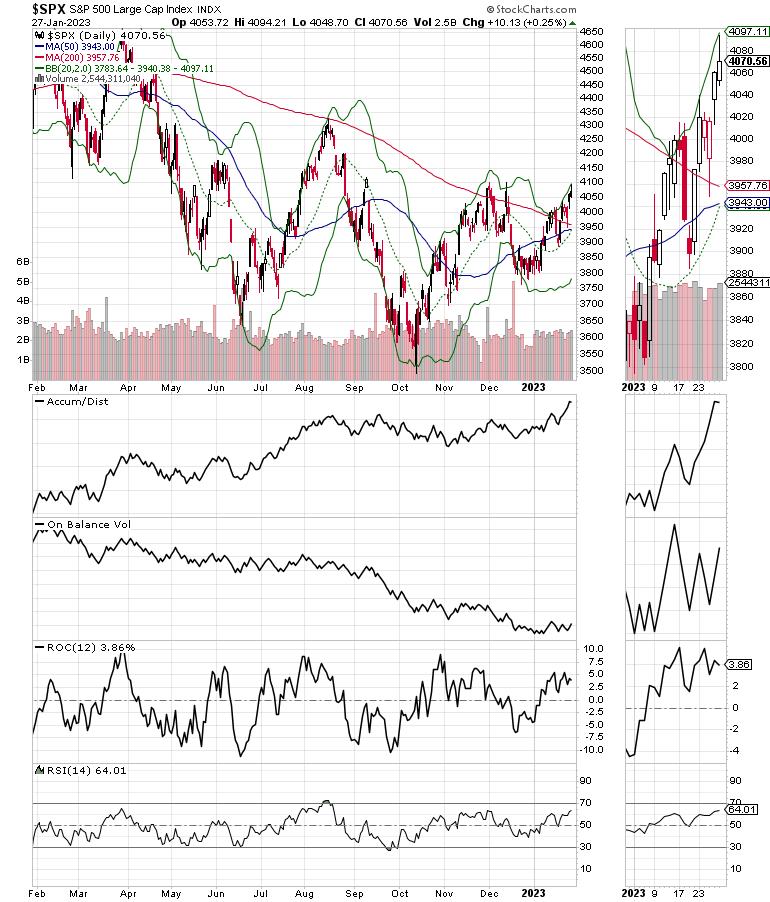
The S&P 500 is close to breaking out above the 4100, having now moved fairly decisively above its 20-, 50-, and 200-day moving averages. At the same time, ADI has been steady and OBV has bottomed out while attempting to turn up. That means that there is now net buying in stocks, even if it's in spurts.
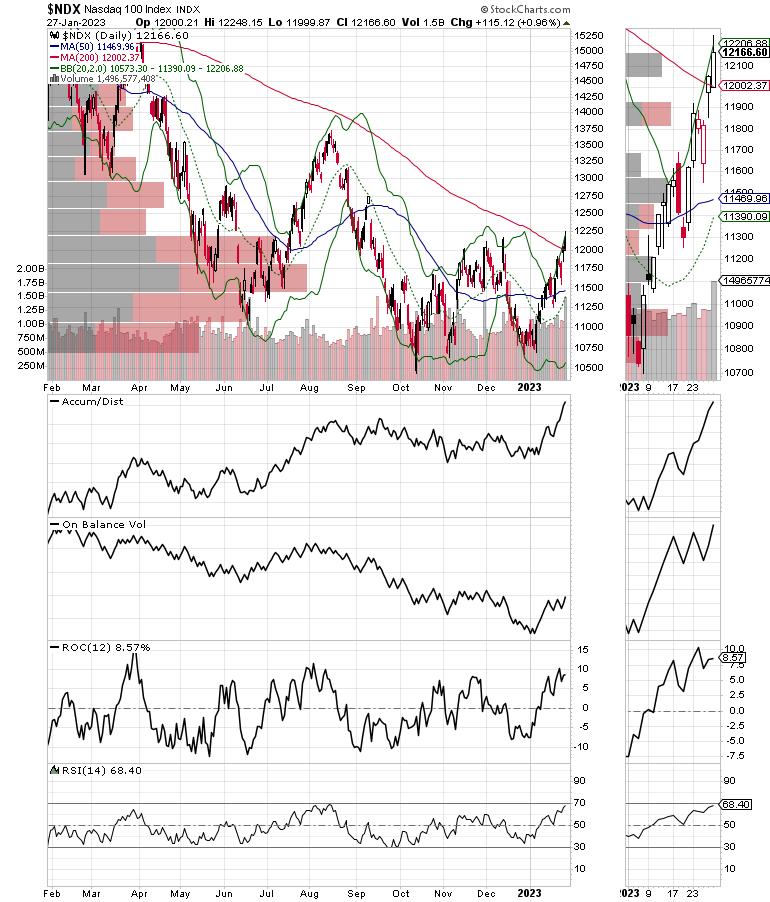
The Nasdaq 100 index has made a fairly concrete triple bottom, even as it continues to lag the S&P 500. It's still possible that it may have made a triple bottom, with the 10,500-10,700 price area bringing in some short covering. The index is now above 11,000, while the real test is what will happen at the 12,000 area and the 200-day moving average.
To get the latest up-to-date information on options trading, check out Options Trading for Dummies, now in its 4th Edition—Get Your Copy Now! Now also available in Audible audiobook format!
 #1 New Release on Options Trading!
Good news! I've made my NYAD-Complexity - Chaos chart (featured on my YD5 videos) and a few other favorites public. You can find them here.
Joe Duarte
In The Money Options
Joe Duarte is a former money manager, an active trader, and a widely recognized independent stock market analyst since 1987. He is author of eight investment books, including the best-selling Trading Options for Dummies, rated a TOP Options Book for 2018 by Benzinga.com and now in its third edition, plus The Everything Investing in Your 20s and 30s Book and six other trading books.
The Everything Investing in Your 20s and 30s Book is available at Amazon and Barnes and Noble. It has also been recommended as a Washington Post Color of Money Book of the Month.
To receive Joe's exclusive stock, option and ETF recommendations, in your mailbox every week visit https://joeduarteinthemoneyoptions.com/secure/order_email.asp.
