
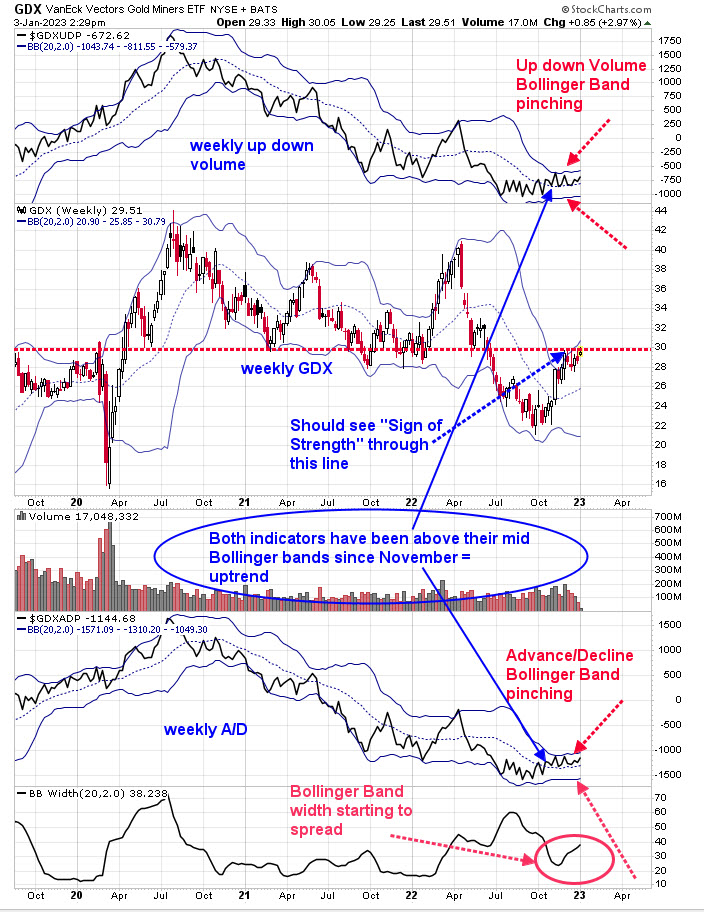
Last week, we said, "Both of the weekly 18-day averages of the up down volume and Advance/Decline indicators Bollinger Bands are pinching suggesting a large move is nearing. We marked with red arrows the Bollinger Bands' pinch on these indicators. Both indicators are above their mid-Bollinger bands, showing both indicators are in an up mode. The bottom window is the Bollinger Bandwidth; it is low when the Bollinger bands are at a narrow range and is high when they are wide apart. When the Bollinger Bandwidth is low and turns up, that is when large moves can happen. The Bollinger bands have been narrow for several months and are not starting to turn up on these indicators; the indicators are rising, suggesting the move will be up. The indicators rally, and so will GDX. We marked on the weekly GDX portion, noting that GDX is at a breakout line, and to get through this trend line, a "Sign of Strength" should show up. Notice also that GDX is not backing away form the trend line, which, in turn, suggests supply is being absorbed." Added to above, the commentary circled in blue shows that both indicators are above their weekly mid-Bollinger Bands since November, implying the trend is up. Also notice that both mid-Bollinger Bands are turning up, which adds to the bullish picture for longer term.
Tim Ord,
Editor
www.ord-oracle.com. Book release "The Secret Science of Price and Volume" by Timothy Ord, buy at www.Amazon.com.
Signals are provided as general information only and are not investment recommendations. You are responsible for your own investment decisions. Past performance does not guarantee future performance. Opinions are based on historical research and data believed reliable; there is no guarantee results will be profitable. Not responsible for errors or omissions. I may invest in the vehicles mentioned above.