The release of the March payrolls numbers threw a wrench into the notion that the US economy is slowing. At the same time, given all the negative data which preceded it, the big question is when the market will start to doubt the veracity of the monthly employment numbers.
Just a week ago, the stock market was back in a technology sector-fueled uptrend. But, on April 4, a major trend reversal took hold as JP Morgan (JPM) CEO Jamie Dimon remarked that the banking crisis was nowhere near over and that the repercussions would last for years. His remarks were reinforced by a slew of data showing a rapid slowing of the US economy.
By Thursday, ahead of the Good Friday market closing, the market had found support. But when the employment data was released on April 7, 2023, everything was once again up in the air, although the stock index futures moved slightly higher on the news.
The report delivered lower-than-expected private jobs at 189,000. A higher-than-expected number of government jobs boosted the overall print, which totaled 236,000. Hourly wages rose slightly, but hours worked dropped slightly. The highest number of new jobs was in the waiter/bartender category.
That was seen as a middle-of-the-road number. Yet it doesn't jibe with the private market data.
Private Market Data Points to Worsening Labor Market
Before Friday's employment report, Purchasing Managers' data (ISM, PMI) showed a slowing economy as new orders faltered. Government jobs listings (JOLTS) weakened. The ADP private sector jobs created showed job creation stalling. The recent Challenger Jobs Cut report showed an increase in layoffs.
Inside the ADP data, the numbers from the Southern US, an area of strength, showed net job losses. This is significant, as the South has been the strongest economic area of the country, boosted by the migration of people from the East, West, and Midwest.
Here is the regional breakdown of the ADP new jobs created numbers:
- Northeast: 141,000
- Midwest: 132,000
- West: 95,000
- South: (-) 228,000
These numbers reflect a slowing in new job creation, not necessarily layoffs. Reductions in manufacturing and financial services led the way, suggesting banking sector weakness. Moreover, manufacturers are struggling as export orders fall, a point made in the ISM and PMI data.
The Challenger Jobs Cut report and weekly jobs claim data from the Bureau of Labor Statistics added to the weakening picture. Challenger reported 89,000-plus job cuts for March, 270,000-plus for the year. The West Coast was the biggest contributor. Here is the breakdown of Challenger's numbers:
- East: 13,638
- Midwest: 21,764
- West: 48,123
- South: 6,178
The Technology sector accounted for 102,391 during the first three months of 2023. The bottom line is fourfold:
- New job listings are falling;
- New job creation is stalling;
- Layoffs are increasing; and
- The number of people requesting unemployment insurance is on the rise.
Bond Yields Collapsed, Mortgage Rates Follow
Before the jobs number, stocks were volatile and bond yields fell. The 10-Year US Treasury Yield index ($TNX) broke decisively below 3.5%, finishing the week below 3.3%, as bond traders bet on a recession. The initial response in muted Friday bond futures trading was a rate uptick to just below 3.4%.
Of note, as I detail below, homebuilder stocks paused. The ADP data, showing job weakness in the South U.S., could be a problem, given that this is where the largest growth area for new homes is currently.
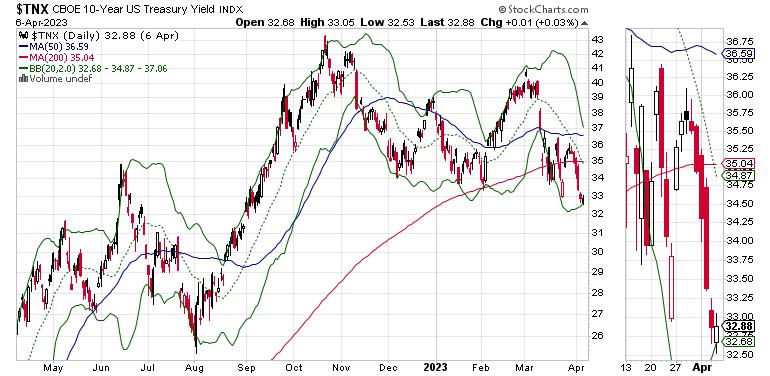
If the bond market is correct, the US economy is heading for recession, and the Federal Reserve will be pressed to lower interest rates. The Fed meets on May 2-3.
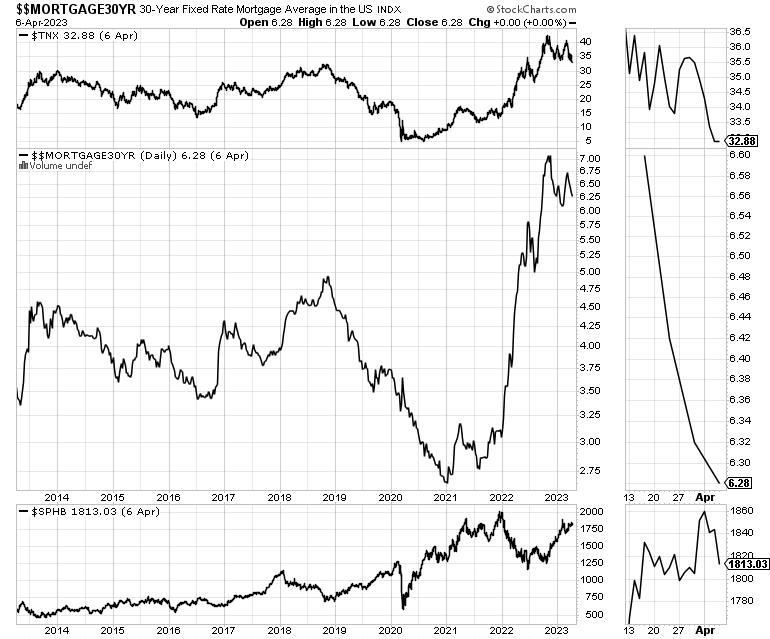
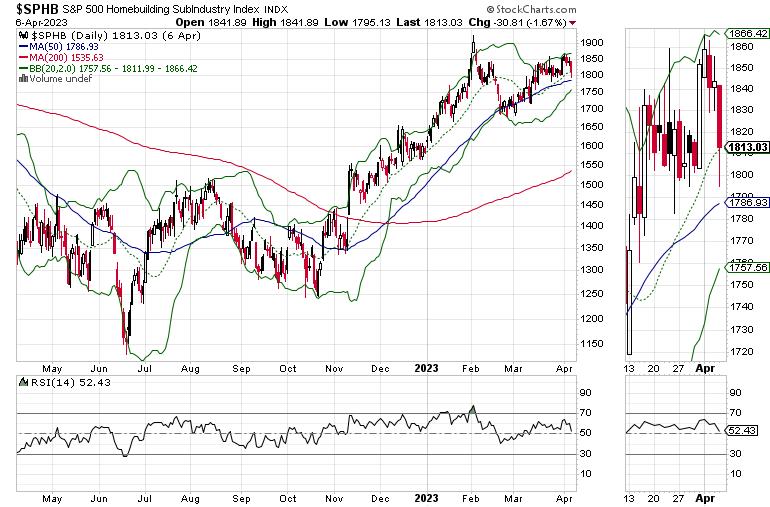
Mortgage rates continue to fall, which is generally bullish for homebuilders. A multi-year view of the relationship between bond yields ($TNX), the price action in the Homebuilders Subsector Index ($SPHB), and mortgage rates ($$MORTGAGE) document the close relationship between these three indicators.
To view my homebuilder picks click here.
Focusing on the Right Homebuilder is the Right Approach in a Volatile Market
In the short term, the SPDR S&P Homebuilder ETF (XHB) remains in an uptrend, as it is trading above its 50-day moving average. The current trading pattern suggests a likely continuation of a consolidation pattern. Still, in this market, it's best to consider individual homebuilder stocks.
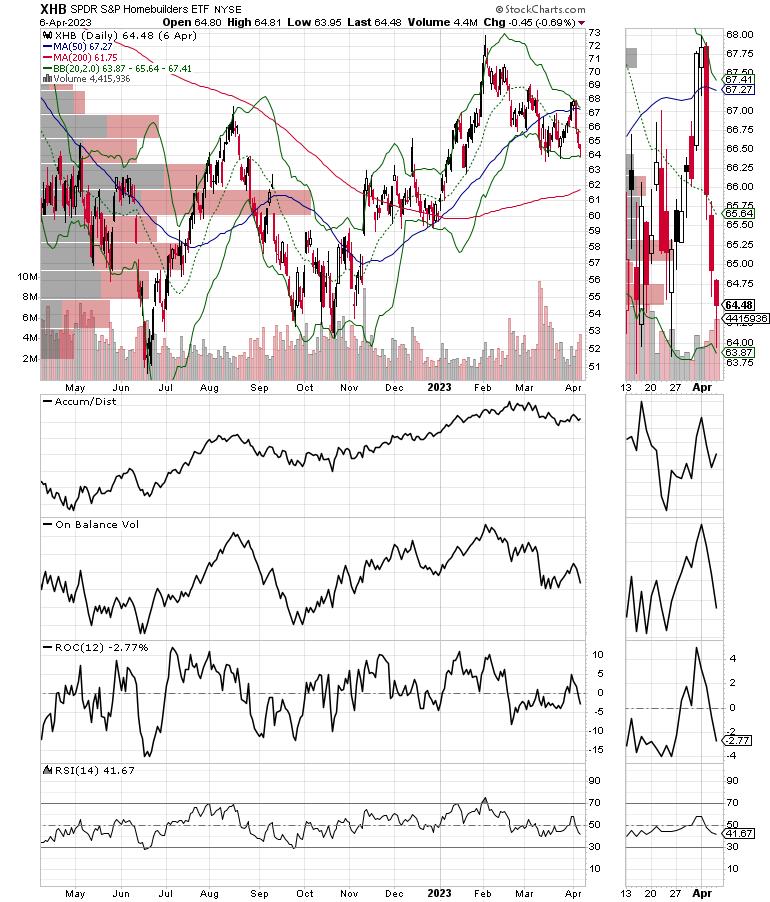
That's because, even though XHB is a useful tool, it's not a pure gauge of the homebuilder stocks. The ETF holds the stock of companies that supply materials to homebuilders, as well as specialty homebuilders such as Cavco Industries (CVCO). Cavco makes manufactured homes, and although its recent earnings and revenues have been excellent, any type of weakness in the economy—such as a precipitous decline in the job market for the Southern U.S. (ADP data above)—would likely affect it more negatively than other homebuilders.
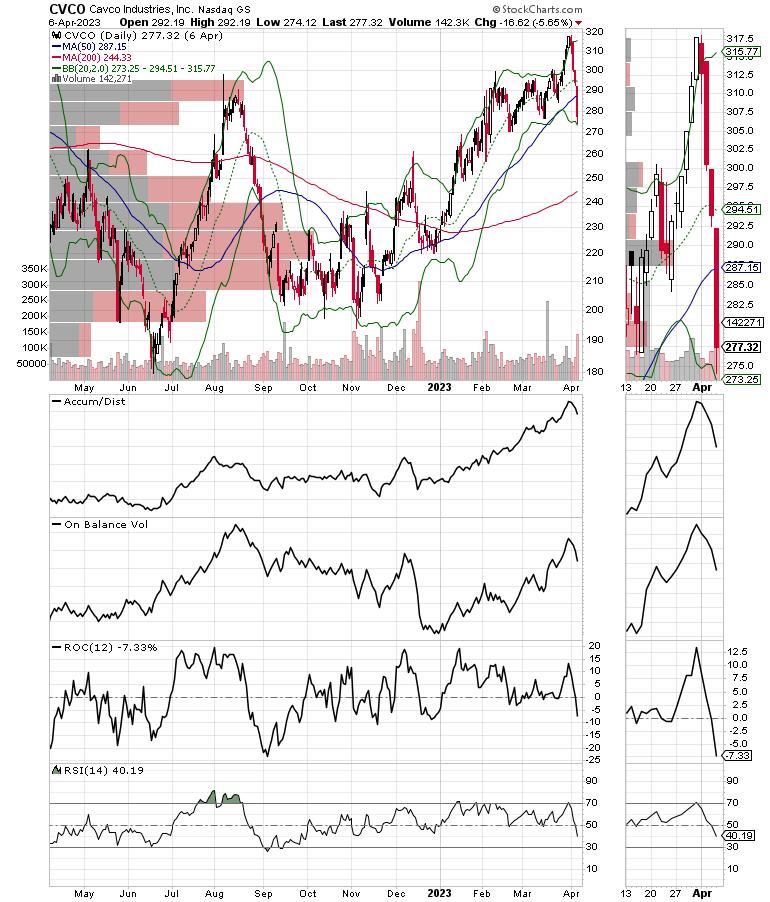
Comparing CVCO to Lennar (LEN), a homebuilder that targets a higher income bracket, you can see the weakening employment situation in the South was not as large a negative on LEN.
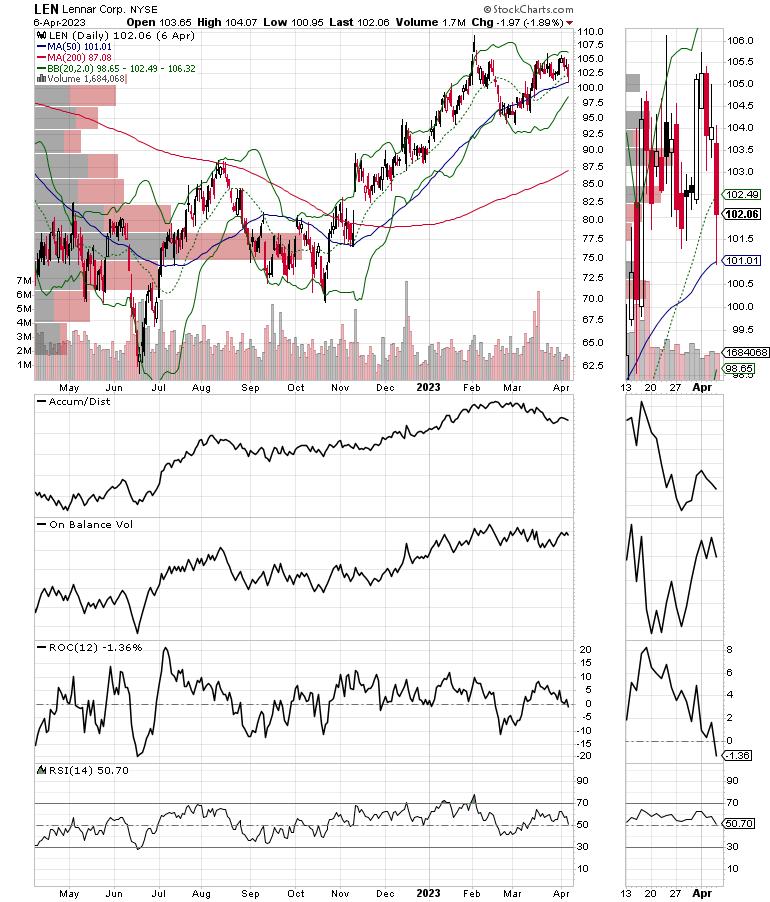
As a result, the action in CVCO and other individual companies in XHB can assert negative pressure on the ETF. In other words, this is one of those times when owning individual homebuilder stocks may outperform owning the entire sector.
I discussed the long-term investment potential in homebuilder stocks in my latest Your Daily Five video, focused on investing in Megatrends. And I've just put the finishing touches on a Special Report titled: "How to Invest in the Housing Megatrend," which is you can download my Buy me a Coffee page.
Breadth Pauses. Nasdaq Holds 13,000.
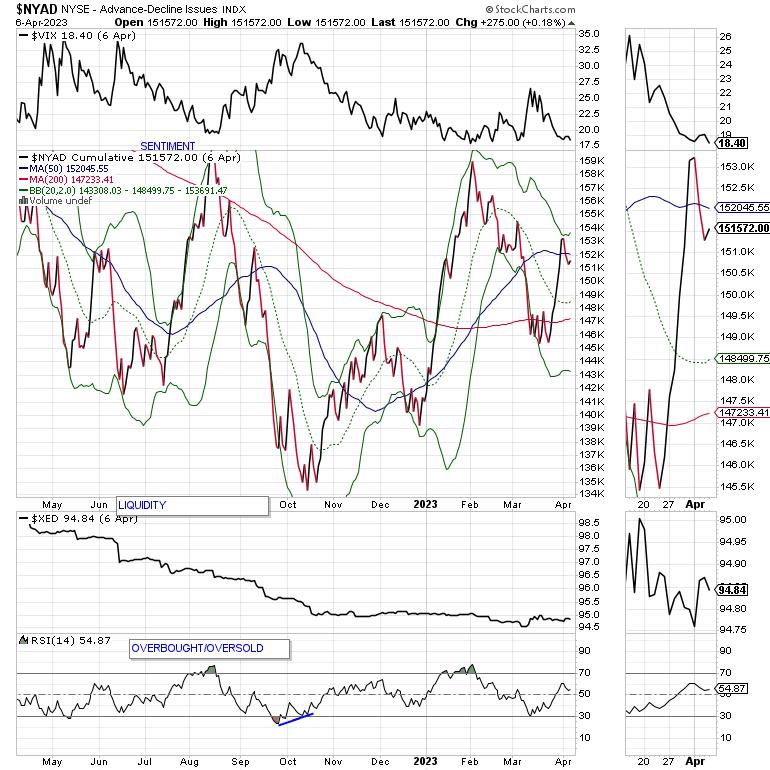
The market's breadth did not break last week, but did show some weakness, as the New York Stock Exchange Advance Decline line (NYAD) dipped below its 50-day moving average while remaining above its long-term support line, the 200-day moving average.
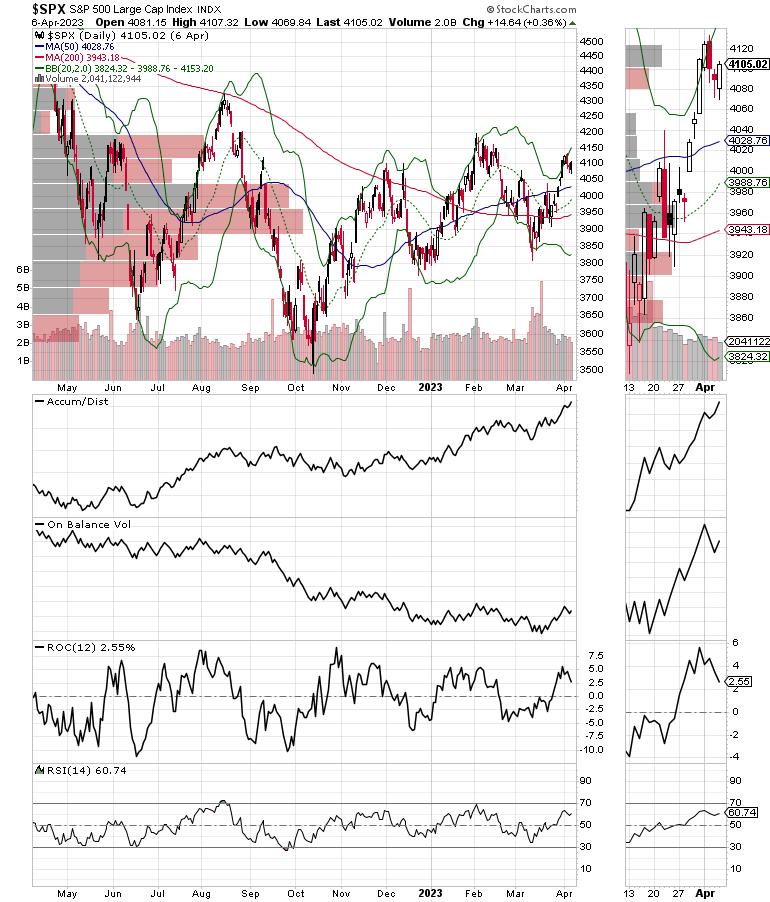
The S&P 500 index ($SPX) also held up closing above 4100. 4100-4200 is still an important resistance band. On Balance Volume (OBV) and Accumulation Distribution (ADI) remained constructive.
Meanwhile, the Nasdaq 100 Index ($NDX) held above its breakout level 13,000, which now becomes support. This remains bullish, as it suggests money is now pouring into technology stocks. When tech stocks rally, they give the whole market a boost. Accumulation Distribution and OBV are very bullish for $NDX.
The Cboe Volatility Index ($VIX) has broken below 20, a sign that the bears are throwing in the towel. The recent low is 17. A break below that would signal a severe decline in bearish sentiment.
When VIX rises, stocks tend to fall, which is a sign that market makers are selling stock index futures to hedge their put sales to the public. A fall in VIX is bullish, as it means less put option buying, and it eventually leads to call buying, which causes market makers to hedge by buying stock index futures, raising the odds of higher stock prices.
The market's liquidity remains stable as the Eurodollar Index ($XED) remained above support, near 94.75. A move above 95 will be a bullish development for sure. Usually, a stable or rising XED is very bullish for stocks. On the other hand, in the current environment, it's more of a sign that fear is rising and investors are raising cash.
To get the latest up-to-date information on options trading, check out Options Trading for Dummies, now in its 4th Edition—Get Your Copy Now! Now also available in Audible audiobook format!
 #1 New Release on Options Trading!
Good news! I've made my NYAD-Complexity - Chaos chart (featured on my YD5 videos) and a few other favorites public. You can find them here.
Joe Duarte
In The Money Options
Joe Duarte is a former money manager, an active trader, and a widely recognized independent stock market analyst since 1987. He is author of eight investment books, including the best-selling Trading Options for Dummies, rated a TOP Options Book for 2018 by Benzinga.com and now in its third edition, plus The Everything Investing in Your 20s and 30s Book and six other trading books.
The Everything Investing in Your 20s and 30s Book is available at Amazon and Barnes and Noble. It has also been recommended as a Washington Post Color of Money Book of the Month.
To receive Joe's exclusive stock, option and ETF recommendations, in your mailbox every week visit https://joeduarteinthemoneyoptions.com/secure/order_email.asp.
