Market Recap for Monday, July 11, 2016
Despite all the reasons for being cautious at this stage of the current seven year bull market rally, nothing is more important than simple price action and yesterday the S&P 500 did what it had never done before - it closed above 2131. Kudos! But then there's the question of sustainability. That's where the debate begins. Is this rally sustainable? I don't believe it is, but betting against a bull market can be a losing proposition. In the Current Outlook section below, I'll spell out a few of the troubling issues for me in trying to back a further rally. For now, let's review the action from Monday.
There was nice rotation into more aggressive areas on Monday as the sector leaderboard showed:
XLI (industrials): +0.63%
XLK (technology): +0.59%
XLY (consumer discretionary): +0.58%
XLF (financials): +0.57%
In addition, the major indices all rallied with the Russell 2000 (+1.08%) and NASDAQ (+0.64%) leading both the Dow Jones and S&P 500 in terms of percentage gains on Monday. The problem is that such leadership has been sorely lacking so in order to feel more bullish, this rotation needs to continue.
Utilities and healthcare were the only two sectors that failed to participate in Monday's fairly broad advance.
Pre-Market Action
Strong action globally overnight and this morning have helped to lift U.S. futures once again as the Dow Jones looks for its turn to close at all-time highs. The NASDAQ and Russell 2000 still have much work to do to reach their all-time highs.
Earnings season officially kicked off last night after the bell as Alcoa (AA) reported better than expected quarterly results and is up more than 5% in pre-market action. Key overhead price resistance will likely be tested in the weeks ahead at 11.28. I'd be a seller at that level until AA proves it can close above it. Should AA close above that 11.28 level with increasing volume, the pattern on its long-term chart would turn much more bullish. Until then, it seems to be range bound between 10.15 (buy) and 11.28 (sell).
Current Outlook
I can identify three separate issues that I have with Monday's breakout on the S&P 500.
1. Volume
Ok, it's been more than a year since the S&P 500 closed at an all-time high of 2131 during this bull market, although it's closed above 2100 43 times (Yes, 43 times!!!!) since. That's a lot of attempts to break through 2131. So surely when the S&P 500 climbs above 2131, EVERYONE will pile in, right? Wrong. The S&P 500 volume on yesterday's historic breakout was 1.91 billion, which was well below the 90 day simple moving average. A low volume breakout is one technical indication that's hard to feel confident about. Check this out:
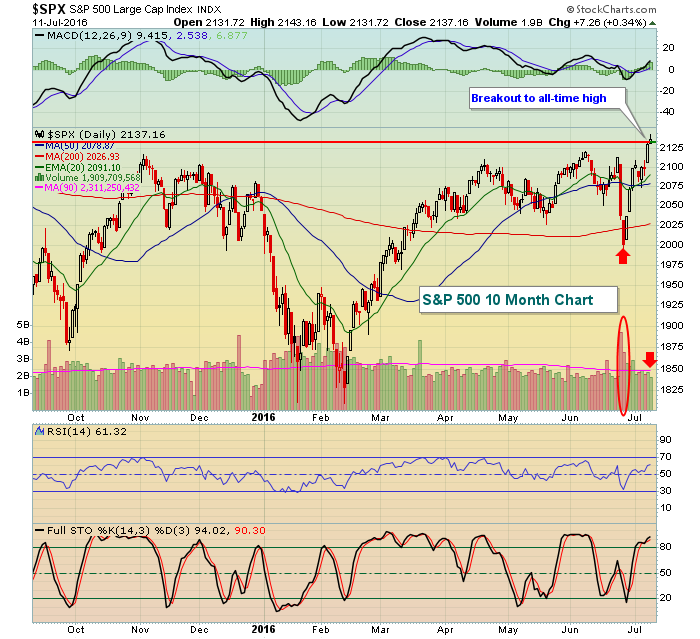 Yesterday's "breakout" volume was the lowest daily volume on the S&P 500 in three weeks. That's not confirming volume and shows little support in terms of accumulation. I need to see more.
2. Rotation
I have written tons on this for the past year or more, but the rotation away from aggressive areas of the market since April has been astounding. Take a look at a couple key ratios that I like to follow:
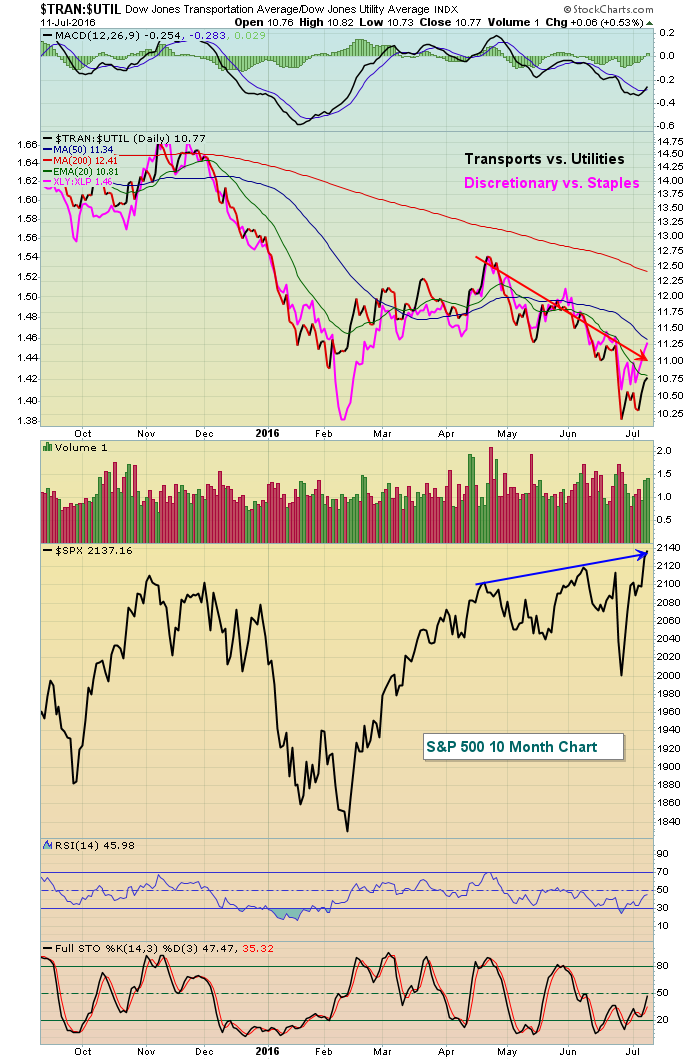 Maybe this bull market will be unlike anything we've seen in recent memory, but this rotation away from aggressive areas is typically very bearish for the S&P 500's future performance.
3. Volatility Index
Volatility has approached support once again where the S&P 500 generally has topped. Another way to look at it is that despite the S&P 500 breaking out, the VIX has not broken down and that suggests that fear remains a bit more elevated now than it did the last time the S&P 500 moved above 2100 and challenged all-time highs. Here's the chart:
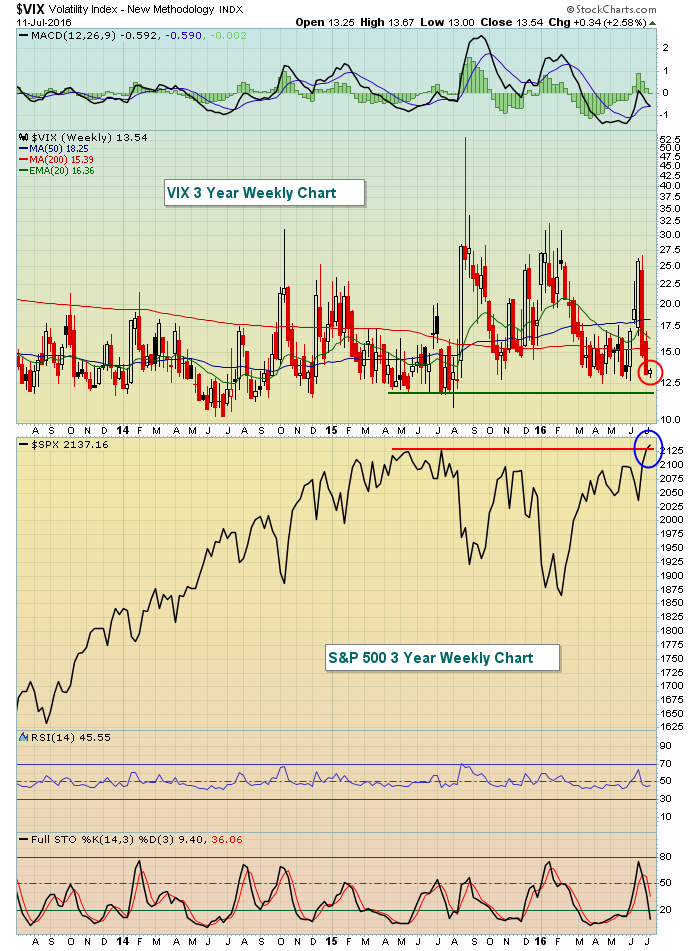 The red circle highlights the inability of the VIX to break down to fresh lows despite the S&P 500 breaking to fresh highs. That elevation in fear could be enough to turn the tables on the bulls - in time.
My conclusion, however, is that a breakout is a breakout and shorting a bull market is very dangerous. So look for a breakdown beneath 2131, or preferably the rising 20 day EMA, before growing more aggressive on the short side.
Sector/Industry Watch
Industrials (XLI) finally made a breakout after watching several defensive areas already make their breakouts. So the good news is that the breakout was made, but why the delay in aggressive areas? I'm not sure, but here's the technical view:
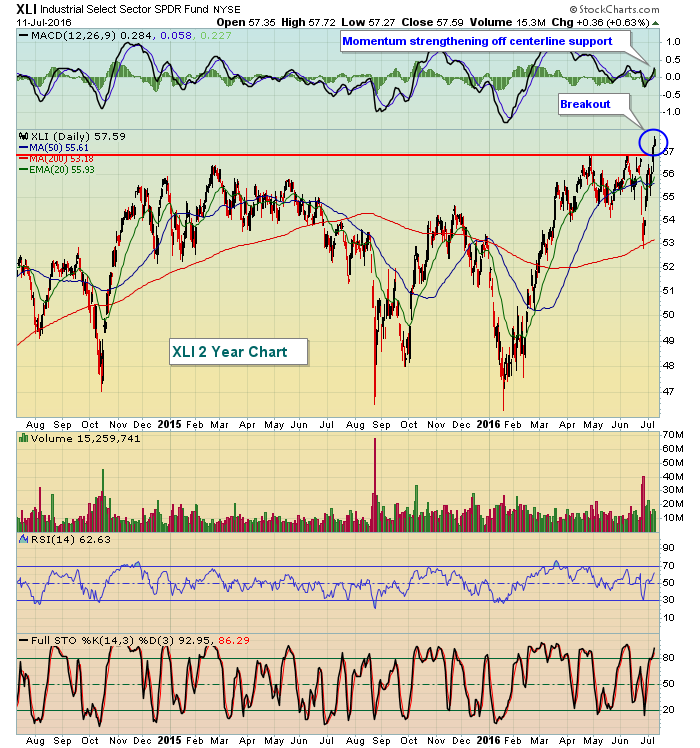 Momentum in the XLI is strengthening so we should respect this rally unless the rising 20 day EMA fails and the breakout fails to hold as support.
Historical Tendencies
The NASDAQ, like the S&P 500 (which I posted in yesterday's blog article), is very bullish historically this week. Here are the annualized returns since 1971 by calendar day:
July 12 (today): +122.39%
July 13 (tomorrrow): +84.37%
July 14 (Thursday): +72.24%
July 15 (Friday): +39.69%
Key Earnings Reports
(actual vs. estimate):
FAST: .45 vs .48
(reports after close, estimate provided):
ADTN: .19
Key Economic Reports
May wholesale inventories to be released at 10:00am EST: +0.2% (estimate)
Happy trading!
Tom
