Last week saw all of the major averages post modest gains with the Russell 2000 (+2.3%) leading the way. The Nasdaq fell on Friday while the other averages rose and that behavior is consistent with a big change that happened last week on the Nasdaq's chart:

Prior to 23-Feb, the Nasdaq's 50-day Moving Average had provided support for the index on numerous occasions going back 12 months. On 23-Feb, the index moved below the average and then, last Tuesday (01-Mar), the index tried but failed to move back above that average. Friday's action provided more evidence that the 50-day moving average is now a resistance level for the Nasdaq for the first time in a year.
CANDLEVOLUME AND THE TRIX
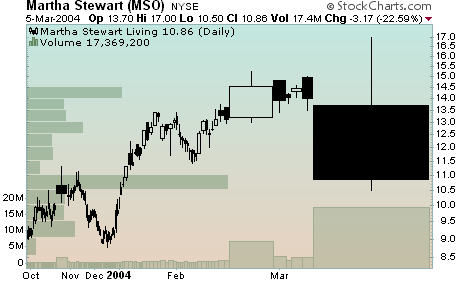
CandleVolume charts are a new addition to StockCharts.com making their debut just this weekend (See the "Web Site News " section below for details). They are constructed just like regular candlestick charts with upper and lower "shadows" as well as filled and hollow "real bodies". Their distinctive characteristic is the width of each candlestick, which varies based on the volume for that particular time period. The higher the volume, the wider the real body of the candlestick. Here's an example chart ripped, as they say, straight from the headlines:

As you can see, the days where volume was extremely high really stand out on a CandleVolume chart!
One thing to be careful about however is to realize that the horizontal (time) axis is no longer linear - i.e. every time period is a different width. That can throw off traditional trendline and chart pattern analysis and, while we do plot indicators and overlays on these charts, they get "stretched and squeezed" also along the horizontal axis.
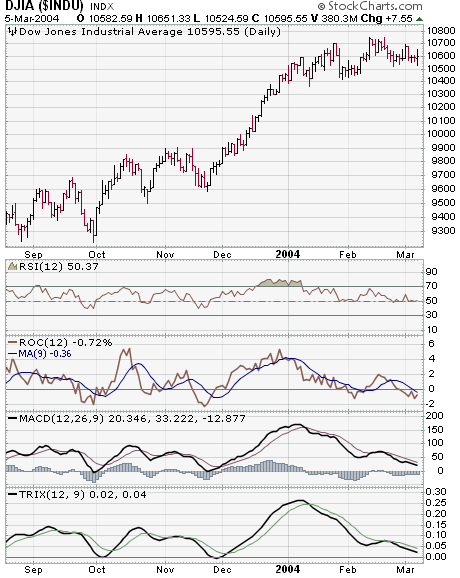
Another great tool that StockCharts.com is introducing this week is the TRIX indicator. The TRIX is a triply smoothed momentum indicator similar to the Rate-of-Change (ROC) indicator and the MACD. Like the ROC, it takes a single parameter which is the number of periods to use in the calculation. An optional second parameter is used to create a "signal line" MA that overlays the TRIX and can be used for cross-over signals.

The TRIX is an unbounded oscillator that moves above and below the zero line. By using three layers of exponential smoothing, the TRIX removes many "unimportant" price movements and help you focus on the longer-term trends. By the same token however, the TRIX can lag other indicators significantly. It is most useful for confirming signals generated by more "skittish" indicators like the ROC and RSI.
WEAK JOBS REPORT A MIXED BLESSING ... Today's weak job report was a shocker. It's weakness, however, is a mixed blessing. It's a potential negative for the economy since it erodes consumer confidence. At the same time, its negative economic message pushed bond yields sharply lower. Lower interest rates are good for the economy. That's probably why the stock market recovered today led by rate-sensitive stocks. But there's more. Lower interest rates keep the dollar weak. A weak dollar is bullish for commodity markets. That was seen in today's jump in most commodities. In the past, higher commodity prices have produced higher interest rates which helped stall commodity rallies. This time does seem to be different, which suggests that global deflationary pressures may still be at work. The bottom line is that the stock market doesn't have to worry about rising rates anytime soon. That should be a good thing. It should also be a good thing for commodity investments.

Relative strength or price relative charts provide an idea of which
sectors will lead and lag over the next few weeks and months. These are
formed by dividing the Sector Index by the Wilshire 5000 or another broad
market index. These particular four sectors are positioned according
to the place in an economic expansion in which they perform best. Techs
and Transports are supposed to perform best during the early expansion
phase, while Basic Materials and Energy perform best in the late expansion
phase.
Sector performance suggests that we are in the late phase of an economic
expansion. Techs are starting to weaken as the price relative broke below
its trendline and Transports have totally fallen apart. The two standout
performers are Energy and Basic Materials. Relative to the Wilshire 5000,
the Energy SPDR (XLE) broke above resistance in December and continues
to forge new highs. The price relative for the Basic Materials SPDR
(XLB) fell earlier this year, but bounced in February and remains in an
uptrend.
When the monthly PMO (Price Momentum Oscillator) reaches a range extreme and changes direction, it is a pretty good indication that the long-term trend is changing. PMO direction changes in the middle of the range can often just be "noise", but, when the PMO has a long, sustained move in one direction and changes direction at an extreme overbought or oversold level, it demands our attention.
Such is the case now. The monthly PMO has been moving up for nearly three years, and it turned down this week. The PMO direction change is not official until the end of March , and, if gold rebounds from this correction, the PMO could still be rising as of the close on March 31. However, the situation is critical. Price has failed to hold above the long-term resistance around 415, but it remains above the the most accelerated rising trend line. If that support fails, chances are that gold will enter a correction lasting at least several months.
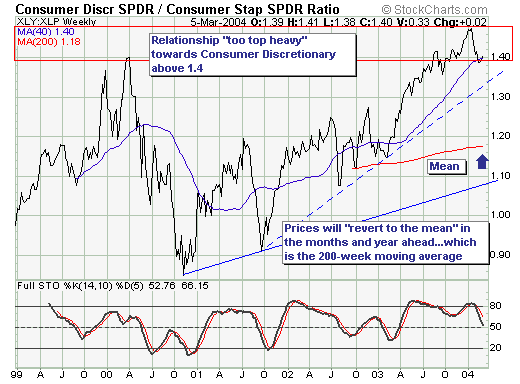
The stock market environment over the past six weeks has been fraught
with a good deal of rotation out of specific indices such as the Dow
and Nasdaq and into the S&P 400 midcaps and S&P 600 small caps.
And it is precisely this rotation effect that we believe is developing
in the weeks and months ahead between the Consumer Discretionary shares
(XLY) and Consumer Staples shares (XLP).
In essence, the relationship between these two is a "signal" into
investor confidence regarding spending patterns - a high ratio such as
at 1.40 or above current levels mind you - indicates a belief stronger
spending patterns are going to continue. However, we believe that given
debt the incremental stimulus amount is likely to fall in the future
means a "reversion" towards the mean will develop. Our target
for this is the longer-term 200-week moving average which implies the
recent decline off the highs is part and parcel of the first leg lower.
Hence, we would be buyers of consumer staples and sellers of consumer
discretionary and in some cases becoming outright short of discretionary
shares - in particular several retailers.
