The markets are rebounding strongly right now and trying to put the declines from February and March behind them. Most of the major averages moved back above their 50-day Moving Average on Friday (not the Dow though...). Smart ChartWatchers will be watching closely this week to see if this rally can continue to gather steam in the face of rising gas prices.
I'm on hiatus this time around. Be sure to check out what John, Arthur, Richard, and Carl have to say below. Catch you next time.
10-YEAR YIELDS SOAR OVER 4%... While today's surprisingly strong jobs report was good for stocks, it was very bad for bonds. Bond prices fell more than two full points. The 10-year T-note, which rises when prices fall, surged all the way to 4.14%. That certainly seems to confirm the idea that long-term rates are finally starting to move higher. There's good and bad news in that. It's good for economically-sensitive stocks that do well in a stronger economy. It's bad for rate-sensitive stocks that are hurt by rising rates. In time, rising rates can be a bad thing. Over the short-run, however, rising rates are viewed as confirmation that the economy is getting stronger and the job picture is finally improving. This week's sector rotations showed a more optimistic market. The top sectors were technology, materials, and industrials. The weakest were financials, energy, utilities, and consumer staples. That rotation is reversing the more cautious mood of the market during the first quarter when consumer staples and energy were the leaders and technology was the laggard.

The Philadelphia Gold Index, $XAU, is usually a better predictor of gold than gold is of $XAU. The top chart shows $XAU relative to gold or the "price relative". Notice that XAU performs best when the price relative rises ($XAU outperforming gold) and the price relative can be used to confirm or not-confirm strength in $XAU.
$XAU advanced from 73.41 to 112.75 (mid July to early Dec) and outperformed gold over this period. While $XAU went to a new reaction high at 113.41, the price relative formed a lower high for a bearish divergence (red arrow). This was a clear sign that $XAU was underperforming gold and led to the double top.
More recently, gold moved to a new high and $XAU failed to follow suit. $XAU managed to find support at 95 and break above 105, but the index remains well below its January high. $XAU is underperforming gold and this should be a concern to gold/XAU bulls.
Does the world really need another indicator?
Well, this is one we have been collecting data on for years, but we
just recently started charting it because we discovered it presents
a good picture of internal market strength or weakness.
Our Price Momentum
Model (PMM) is a simple but effective mechanical model that we apply
to all the stocks, indexes, and mutual funds we track. The PMM is
always on a buy or sell, and it generates new signals when: (1) price
moves 10% in the opposite direction of the signal extreme and (2) crosses
the 200-EMA. For example, if the model is on a buy signal, a sell
signal will be generated when the price index drops 10% from the highest
price recorded during the buy signal and crosses down through the 200-EMA.
(See http://www.decisionpoint.com/Glossary/PriceMomentumModel.html
to learn more about the model.)
Since we track every stock in the
Dow, Nasdaq 100, and S&P 500, we can calculate the percentage of the
stocks on PMM buy signals. The resulting indicator is similar to the
Bullish Percentage Index, which uses point and figure buy signals,
but our PMM indicator tends to be a bit less volatile because a PMM
signal change is harder to generate.
Currently, the indicator for the
Nasdaq 100 (NDX) shows that considerable damage was done to the
stocks in the index during the correction, as our indicator dropped
below 50%; however, it is bouncing back nicely.
When the Percent PMM
Buy index is above its 32-EMA, we generally consider the market environment
to be positive because it shows a persistence in stocks being
able to generate PMM buy signals. When it is below the 32-EMA, more
caution is warranted, although it is possible for a market index
to advance with only half its components participating (on PMM buy
signals) because most indexes are capitalization weighted.
I think this indicator is most useful
in evaluating the validity of major bottoms. If it can't move above
its 32-EMA, it says the rally is not broad and is being led by a few
large-cap stocks. Note how participation rose to over 90% within the
first months of the 2003 bull market advance. This was also the case
with the S&P 500, Dow, and the 112 Dow Jones US Sectors (which
moved to 99%!).
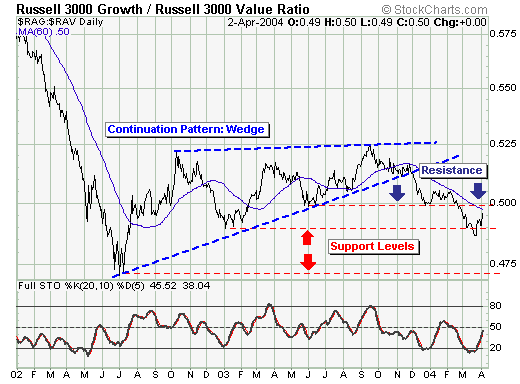
In terms of gauging the current substantial
rally, we should look at the relative performance of the "growth" and "value" components
thereof. In effect, if we are bullish, then we want to be long that
which is outperforming. This is fairly simple.
Thus, when we look at the Russell 300 "Growth
vs. Value" Ratio - we find the longer-term pattern is a confirmed "bearish
wedge" continuation pattern, which augurs for lower lows than that
seen during June/July 2002. However, a good short-term level in which
to become sellers or buyers happens to be the 60-day moving average.
In fact, Friday's sharp rally in the growth stocks has taken prices
right back to this now important resistance level. If prices break
above it - then one obviously wants to be long growth stocks over the
next several weeks. But, if resistance proves its merit...then growth
stocks will lag, and one could reasonably become short selected growth
shares. In any event - any growth rally will be short-lived given the
bearish wedge interpretation...which should translate into lower equity
prices overall.
