All-in-all, last week was a down week for the major market averages. While the Dow managed to eek out a tiny gain, the other indices fell with the Nasdaq (-2.79%) leading the way. So far this year, the energy-heavy Amex Composite (+5.64%) and the Russell 2000 (+4.75%) are outpacing the other markets with the Nasdaq off 0.38% and the Dow essentially where it began the year.
"Change" appears to be the theme for this week's edition. John and Richard both look at changes that are underway in the sector picture, Carl has indications that change is coming to the Precious Metals sector, and Arthur looks at changes in the Nasdaq's OBV chart. But first, I hope to "change" your approach to scanning...
SCANNING FOR CHANNELS
In the past, I've written articles on scanning for Divergences, Cross-Overs,
and P&F Signals. This week I'd like to demonstrate how one goes about
scanning for Channels. A Channel is a pattern where a stock has been
moving sideways within a given range for a given period of time. In the
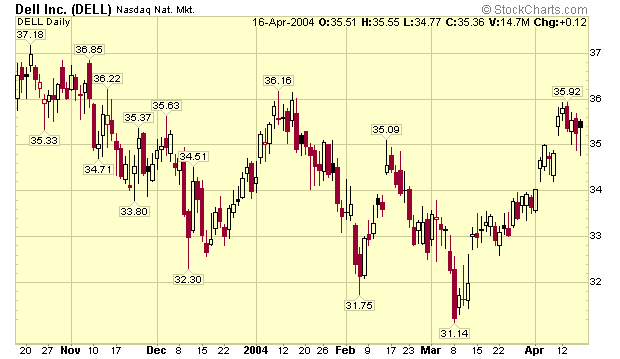
example below, DELL has been moving sideways between 30 and 40 for over
6 months.
In order to scan for stocks in a channel, you have to decide up front what the
upper and lower bound of your channel will be along with minimum the
length of time that a stock has to remain within that range. Let's see
if we can find other stocks that have been bouncing within the same 30-40
channel that DELL has been in for at least 6 months. We can use the Standard
Scan Interface for this (I recommend always using the Standard Scan
Interface whenever possible). The "secret" to creating this
kind of scan is to use the "Max. High" and "Min. Low" functions.
Each one takes a single parameter which is the number of periods (days
or weeks) to look back. Here's what the completed scan looks like:
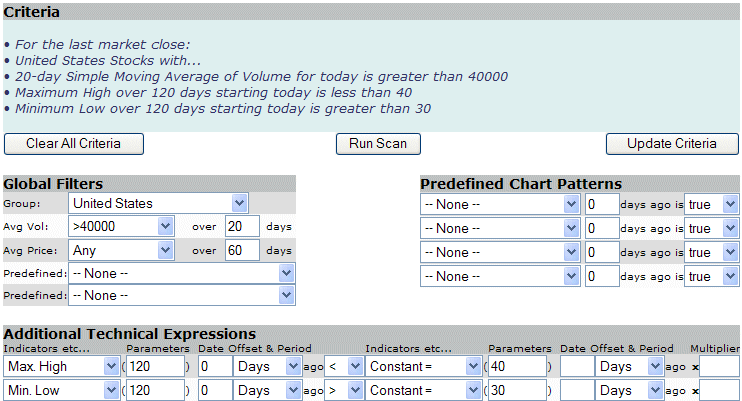
The key lines are in the "Additional Technical Expressions " section.
The first line makes sure that we only look for stocks that have not
risen above 40 during the past 6 months (= 6 x 4 = 24 weeks = 24 x 5
= 120 days). The second line checks to see that we only find stocks that
have not fallen below 30 during those same 6 months.
I can run this scan and then use the CandleGlance technique described
in my article "Visual System Development" to verify that the
results returned by the scan are correct. Right now (Saturday, April
17th), the scan is returning 63 stocks including DELL (of course), YUM, and even
QQQ!
SCANNING FOR CHANNEL BREAKOUTS AND BREAKDOWNS
It's a simple matter to enhance the scan above so that it finds stocks
that have just broken out of a channel. Simply add a 1 period offset
to the "Max. High" and "Min. Low" criteria lines
and then check to see if "today's" close is above/below the
limits of the channel. For example, here's a scan that finds all of the
stocks that have just moved above the top of the 30-40 channel we've
been using:
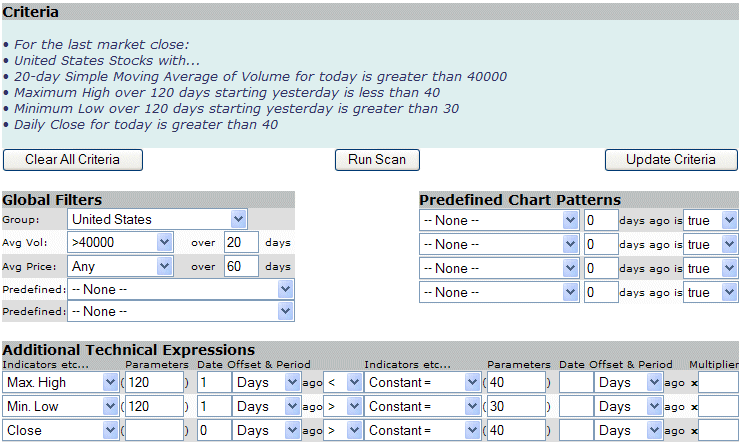
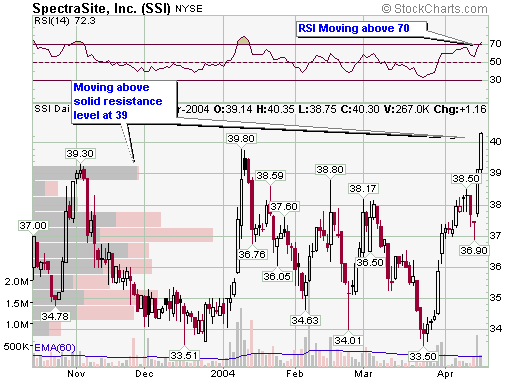
Right now, only one stock meets that criteria - SSI. Is SpectraSite breaking out? There are several positive developments on its chart:
As always, successful scanning requires you to carefully review these
examples, experiment with them until you are comfortable with how they
work and then carefully incorporate them into your analysis work. Since
scans can be used (and mis-used) in so many different ways, YOU need
to invest time and effort in learning all about them first but I guarantee
you that it is time and effort well spent. Hopefully, this article (and
the previous ones I linked to) will help you get off on the right foot.
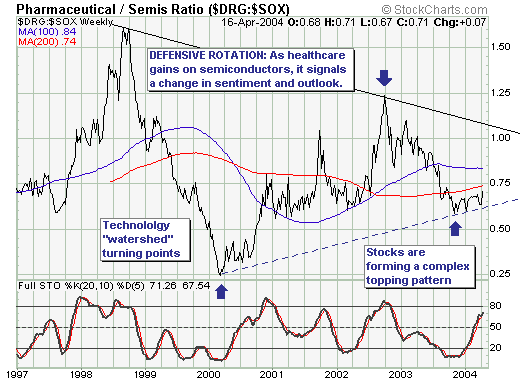
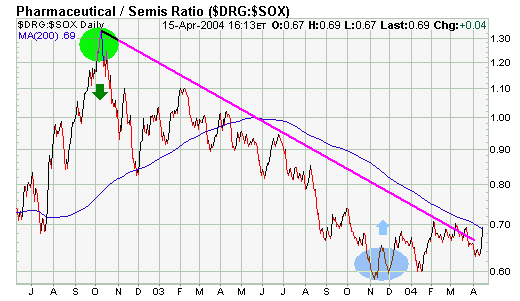
DRG/SOX RATIO IS RISING... Earlier in the year I did an analysis of the DRG/SOX ratio as a way to try to
measure the mood of the market. The ratio divides the Drug Index (DRG) by the
Semiconductor (SOX) Index. The idea is that when investors are confident they
buy chips and sell drugs. That pushes the ratio lower. That's what happened
during October of 2002 when the market bottomed (see green circle). The
downtrend in the ratio continued until last November when it started bouncing
(blue circle). Its been trading sideways since then as the market rally has
stalled. When investors turn more cautious, they sell chips and buy the more
defensive drugs. That pushes the ratio higher. The DRG/SOX ratio is approaching
the top of its six-month range and is close to moving above its 200-day moving
average for the first time since last spring. The ratio has already broken its
eighteen-month down trendline. An upside breakout in the DRG/SOX ratio would, in
my opinion, signal a significant shift to a more defensive market mood. The two
main reasons for that are rising energy prices and rising interest rates. That
also explains why investors are selling rate sensitive stocks and buying energy.
None of these rotations are good for the market as a whole.
On Monday we were focused on the pennant consolidation with support
at 2038 and resistance at 2080 (gray oval). While these are typically
bullish continuation patterns and an upside breakout was expected, it
was prudent to wait for confirmation. Instead of the expected, the break
came to the downside and the index has moved into corrective mode. A
50-62% retracement of the prior advance (1896 to 2080) would extend to
the 1970-1990 area and broken resistance turns into support around 2000.
A move below 1970 would be more than just a normal correction and suggest
that a bigger decline may be ahead.
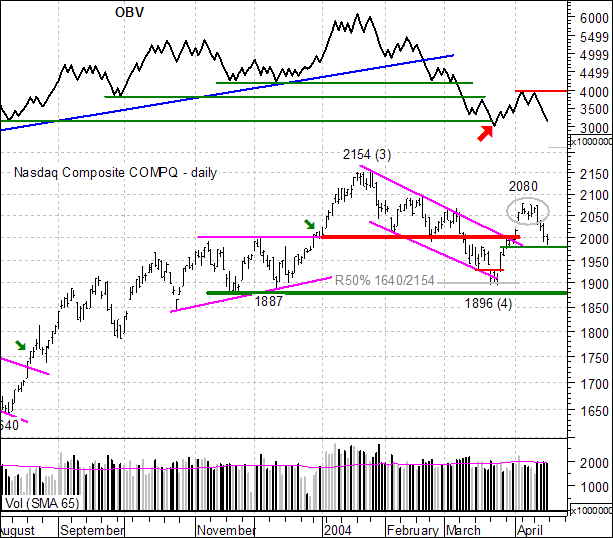
On Balance Volume (OBV) was developed by Joe Granville in the 70’s
and is as simple as it gets. Volume is added on up days and subtracted
on down days. The concern here is the relatively high volume on down
days and the relatively low volume on up days over the last few months.
With the decline from late January to late March, OBV moved below its
December, September and August lows (red arrow) as selling pressure intensified
significantly. The late March/early April bounce is a start, but it would
take a move above the early April high to get OBV back on the bullish
track.
This was an excerpt from the TDT Report, published every Friday. The
remainder includes a primer on measuring relative strength, an application
of relative strength to the HealthCare SPDR (XLV), a look at gold/XAU
with the US Dollar Index, Elliott Waves applied to the S&P 500 and
a Model Portfolio update.
DecisionPoint.com tracks net cumulative
cash flow of Rydex mutual funds as a way of estimating sentiment in
various sectors. The theory is that money 'ought' to follow prices,
more or less. In the last several months this indicator has been rather
helpful in identifying problematic price moves by the appearance of
price/cash divergences.
On the above chart of Rydex Precious
Metals Fund, I have highlighted the first divergence with red circles.
Note how there was virtually no cash flow supporting the advance into
the January price top. An indication that the advance would fail. Next
the blue circles show a blowoff move in February. Lots of money
moved into the fund, but prices failed to respond positively enough.
Again, an indication that the advance would fail.
Now we see a precipitous drop in prices,
highlighted by the green circles; however, note that a proportionate
amount of cash has not yet fled the sector. To me this indicates an
unrealistic optimism, and my conclusion is that prices will have to
drop farther in order to increase bearish sentiment to appropriate
levels.
This past week brought in "clear view" the under the surface
rotation that has been occurring from the technology sector into the
healthcare/pharmaceutical sector - and thus we think it important to
look at the Pharmaceutical/Semiconductor RATIO. That said, this "repositioning" is
extremely important in our overall equity viewpoint; in the past it has
coincided with significant shifts in the overall sentiment of stocks
to defensive or negative - as a change in risk aversion develops.
This point is quite clear at the Sept-1998 peak, at the Feb-2000 low,
and at the Sept-2002 high - each corresponding with a change in trend
for the stock market. Hence, we find it extremely important at this point
given it is nearly universally thought that stocks correcting to move
higher. If this pattern holds, and it still is not clear - then a topping
pattern of proportion is developing...that could last several years if
past patterns hold.
The bottom line - if you are long - you want to be cautious and consider
defensive issues; and if you are inclined to be short...then technology
rallies are to be sold, and to be sold aggressively.
