Rolling over. The short term technical picture shows the markets rolling over right now into a new down leg. The key test will be when the Nasdaq tries to move below 1900 this week. Right now, most technical signals point to much lower prices if that occurs. John Murphy and Arthur Hill have more on the possibilities later on. But first...
SCANNING FOR CHANNELS - TAKE 2
Last issue, I showed you several techniques for creating scans that find stocks that have been moving sideways in a channel between two fixed price levels. But what about stocks that are moving sideways between other price levels? If you're scan is looking for stocks that are stuck between 30 and 40, you won't find stocks that are moving sideways between 80 and 90. Depending on what kind of trading you want to do, that can be a big problem.
The solution is to use percentage-based channels instead of fixed-price channels. A percentage-based channel scans looks for stocks whose maximum high is within a certain percentage (5% for example) of its minimum low for a given period of time. For example, using our Standard Scan interface, you'd create a scan that looks like this:
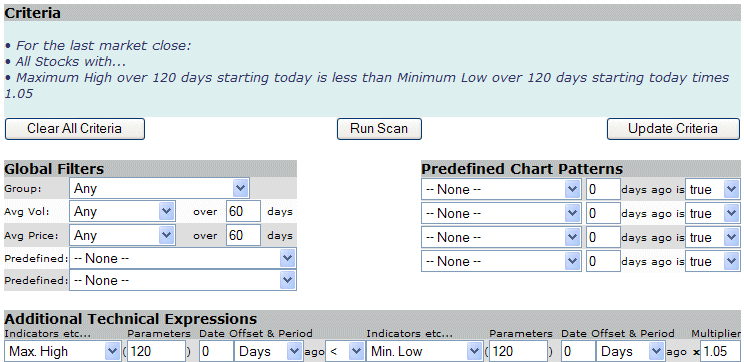
Notice the "1.05" in the Multiplier field? That's how we indicate that we want to find stocks that have been moving within a 5% channel. If we wanted to use a 2% channel instead, we would enter "1.02" into the Multiplier field.
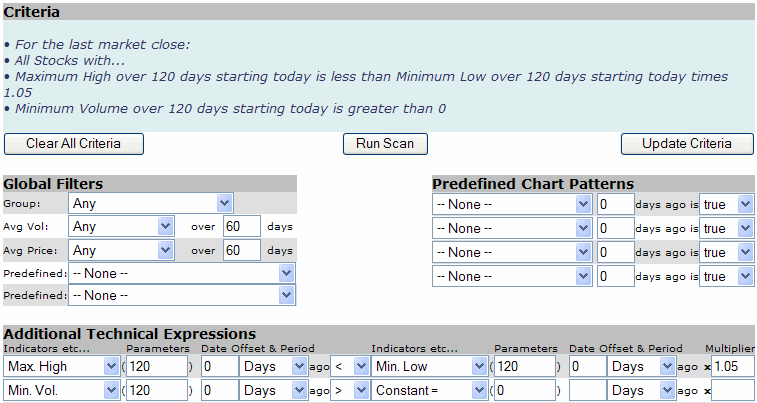
While that scan will do the job, there's still a problem. It turns out that lots of very low volume stocks get returned by percentage-based channel scans. To eliminate those stocks from the scan, we can add another filter that ensures the Minimum Volume for the same period is greater than zero. Here's the final version of our scan:
THE "WITHIN" PROBLEM
Scan Engines are designed to find charts with a specific set of technical criteria on a specific date. Occasionally, we get a question from someone who is trying to use the scan engine to find stocks with a specific set of technical criteria over a range of dates. We call this the "within" problem since they are looking for something that happened "within" a certain time period. For example, "Show me all the stocks that had a MACD crossover within the past month."
The reason our scan engine doesn't support these "within" scans is because you cannot use them in a real-world trading environment. From a high-level perspective, the purpose of scanning is to develop scans that can help you decide which stocks to buy or sell "soon" - i.e. before the data used in the scan changes significantly. The standard scenario is to run your scans after the market closes in preparation for placing orders early the next day. While some of the results from a "within" scan may still be valid, others results may have become invalid by the time the scan is run and, what's worse, you cannot easily tell which is which.
We strongly recommend refining a "within" scan so that it refers instead to "today". For example, take the scan above and turn it into "Show me all the stocks that had a MACD crossover today." You can then use the "Starting" field (at the top of our scan interface pages) to see the results of the scan on any previous day you choose.
Again, the message here remains the same - when scanning, start simple, follow the examples, and experiment. Learning to use scans effectively is not that hard, but it does take time and effort. The rewards can be substantial however so stick with it and let us know how it goes!
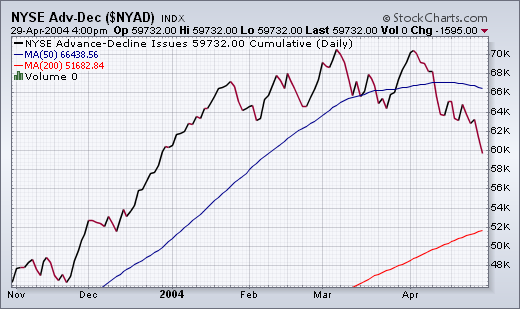
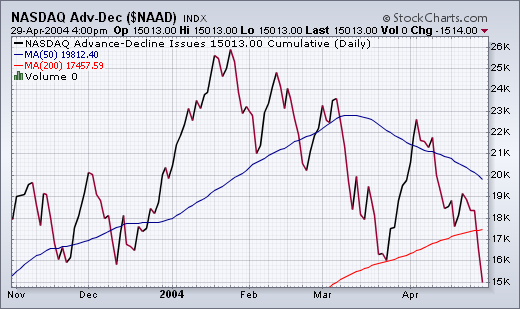
LOWEST LEVEL IN MONTHS... It's been awhile since we've talked about the Advance-Decline lines in the various markets. The two charts below show why we're showing them now. The NYSE Advance-Decline line has fallen to the lowest level in four months. This is its weakest showing since the market rally started last March. The Nasdaq AD line looks even worse and has broken its 200-day moving average. That confirms that most of initial technical damage came from the Nasdaq. Trouble is it's now spreading to the rest of the market. All the more reason to be defensive at this point.
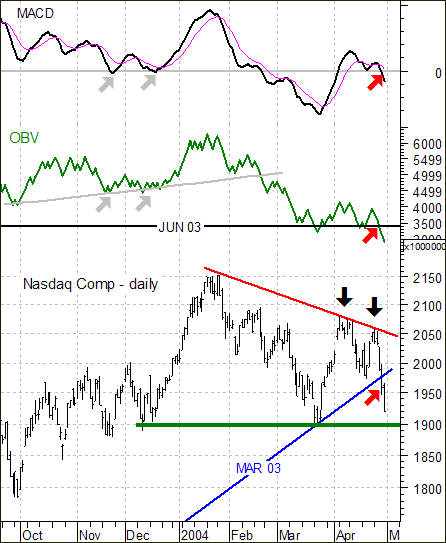
There are three ingredients to a downtrend: lower high, lower low and
trendline break. The final ingredient (trendline break) is open for debate,
but the lower low and lower high are not. With this week’s failure
to hold the big gains above 2030 (22-Apr) and break below the 1978, the
Nasdaq is well on its way to a trend change. The index formed another
lower high below 2100 (black arrows) and broke below the trendline extending
up from March 2003. Two of the three ingredients for a trend change are
in place and a move below the March low (1898) would solidify the reversal.
In addition to the actual price chart, key indicators confirm recent
weakness and point to further downside. MACD moved below its signal line
and into negative territory. This bearish signal is confirmed by On Balance
Volume (OBV), which moved to an 11-month low (red arrows). These indicators
are not correlated and this makes confirmation all the more significant.
Notice that MACD moved into negative territory in November and December,
but this was not confirmed by On Balance Volume (OBV), which held above
its prior lows and continued higher (gray arrows).
This was an excerpt from the weekly TDT Report. The remainder is reserved
for subscribers and includes a look at sector weightings within the S&P
500, analysis of the top six sectors (SPDRs), identification of the two
biggest culprits, analysis of the S&P 500 and the weekly Model Portfolio.
Here's a new chart we've just deployed on DecisionPoint.com, showing the 52-week new highs and new lows for just the stocks in the S&P 500 Index. I think this is useful because it shows what is happening with the stocks in the world's most "indexed" index. I have been collecting this data since 2001, but I have never seen it on a chart before. The most surprising aspect to me was that there were not more new lows in 2002 as the market was putting in a bottom, but I assume this is due to the high sponsorship of these stocks.
Currently, the most obvious feature is the sharp contraction of new highs over the last few months, even as the price index has been bumping along near bull market highs. This is a negative divergence and doesn't bode well for the market this late in the bull run. There has been some expansion of new lows, but nothing to compare to the recent 200 new lows on the NYSE (a reflection of what is happening to interest rate sensitive issues on the NYSE that are not common stocks).
Over the course of the past 4-months, price
action in all of the indices have been "locked" within wide trading
ranges. One question to be be answered is whether this is a "consolidation" to
new highs; or a "distribution" to lower lows. If we had to answer this
- we would suggest that against the fundamental backdrop of higher
interest rates - the financial system has begun "DELEVERAGING" itself
from the "carry trade" estimated to be $1.5 trillion. Therefore, we can
conclude this trading range is a distribution formation...of which
lower prices are developing.
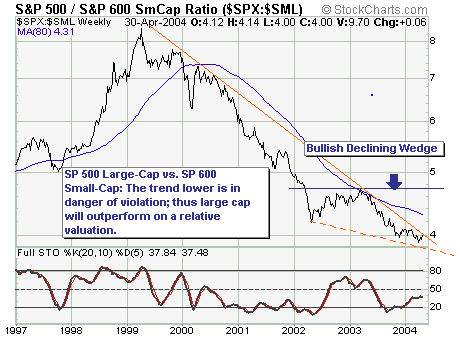
But just as importantly, we must look to "style
type" decisions for trading, of which the ratio chart between the SP
500 Large Cap vs. SP 600 Small-Cap is locked within a clear downtrend.
However, nascent signs are developing that the outperformance
of the SP 600 is coming to a close in the intermediate-term.
The ratio is on the verge of breaking above trendline resistance, which
would then prompt a move into the 80-week moving average...and quite
possibly the previous highs near 4.75. Be prepared.
