The major markets sold off dramatically at the end of the week due, so we are told, to wild speculation in the oil market. The Dow closed at 9815 which is significant because it is less that the 9852 low that it set back in May. This is the "lower low" level that I pointed out in our last edition. Despite all of the teeth gnashing in the financial press, nothing has really changed - yet. The markets are in a downtrend and lower-lows are to be expected. If the current pattern holds, the Dow may bounce some next week, but be prepared for more new lows before its next significant rise.
All our analysts are bearish these days (something that contrarians love BTW!). After I go over John Murphy's "4th Law of Technical Trading", John looks at the real reasons behind this week's fall, Richard sees a rough road ahead for consumer spending, Carl looks at the Oil market, and Arthur Hill examines the A-D lines of popular ETFs.
LAW #4: KNOW HOW FAR TO BACKTRACK
Murphy's Law #4: Measure percentage retracements. Market corrections up or down usually retrace a significant portion of the previous trend. You can measure the corrections in an existing trend in simple percentages. A fifty percent retracement of a prior trend is most common. A minimum retracement is usually one-third of the prior trend. The maximum retracement is usually two-thirds. Fibonacci retracements of 38% and 62% are also worth watching. During a pullback in an uptrend, therefore, initial buy points are in the 33-38% retracement area. - John Murphy
The concept of "retracement" is closely related to the concepts of support and resistance that we looked at last week. When there are no obvious support or resistance levels near the current stock price - maybe because the stock is breaking out to new highs for example - you can often use percentage-based retracement levels to "invent" new support or resistance levels.
To create a percentage retracement level, measure the most recent significant move that the stock made - i.e. the distance from the top of the last important "peak" on the chart to the last important "trough" on the chart. Now, mentally consider that distance to be "100%". By multiplying that number by the appropriate percentage, you can determine where these new "invented" support/resistance levels are.
For instance, as John indicates, stocks often reverse at the 50% retracement level. Thus, you'd multiple the distance you measured above by 0.50 (50% - the same as dividing by 2) to determine how far the stock would need to move (from the previous peak or trough) to hit that retracement level.
If that sounds like a bunch of needless math to you, you're right! And you're in luck - StockCharts' ChartNotes annotation tool can do most of the work for you quickly and easily. Start by creating a SharpChart of the stock you are interested in, then click on the "Annotate" link located just below the chart. In a couple of seconds, our Java-based annotation tool (which we call "ChartNotes") should appear with your chart loaded up and ready. It should look something like this:
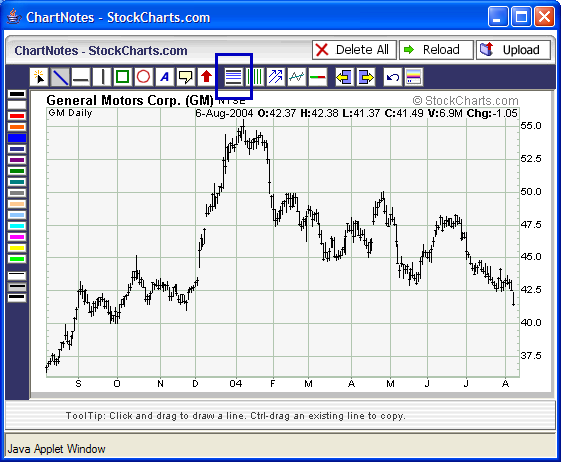
To study retracements, first click once on the "Fibo Retracement" tool from the top toolbar (marked with a blue square). Next, move your mouse to the previous significant peak or trough (on the GM chart above, let's study the big move in December 2003). Then, click and hold down your mouse button while dragging the pointer to the next significant trough or peak. As you drag, we automatically display the important retracement levels and their values. When you have your mouse in the proper place, simply lift up on the button to finalize things. You should see something like this:
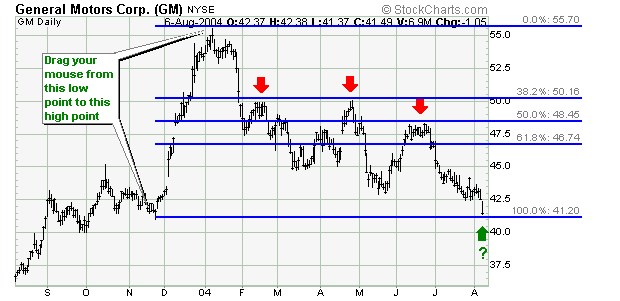
(Note: To duplicate this exactly, you'll need to move your mouse horizontally to the right edge and then use the "Expand Right" tool a couple of times.)
Now, why do retracement levels work at all? What's the "magic" behind them? The magic is the natural human tendency to worry. For example, after a stock has risen for a while, it's natural that some of its stockholders will start to get nervous and start thinking about "locking in" their profits (i.e., selling). The point at which that actually happens is different for each individual shareholder, but statistically, shareholders act on those nervous feelings in three clusters - one around 38%, one around 50% and one around 62%.
In the case of the GM move last December, notice how many of the investors later "locked in their profits" (i.e. "gave up") around the 38.2% and 50% retracement levels of that big move (red arrows).
Retracement analysis lets you and I take advantage of this natural nervousness in others.
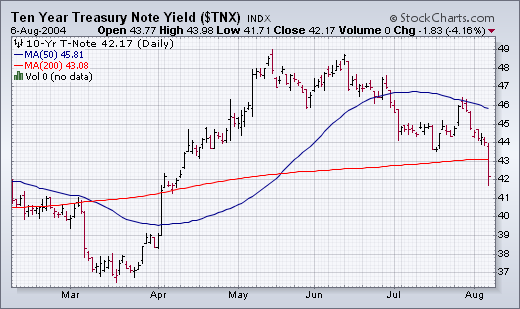
DROP IN BOND YIELDS HURTS DOLLAR, HELPS GOLD... Bond prices surged
on Friday's weak job report. As a result, the yield on the 10-Year Treasury
note tumbled to a four-month low and ended below its 200-day moving average
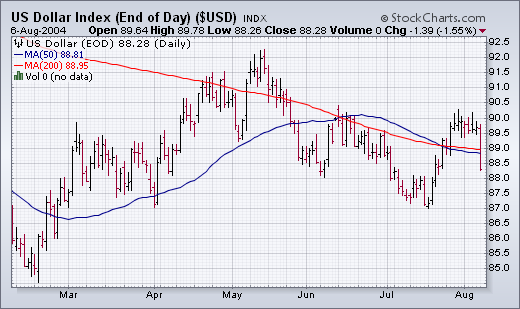
(Chart 1). The sharp drop in U.S. rates pushed the dollar into a 2%
decline. Chart 2 shows the dollar failing at its March high and ending
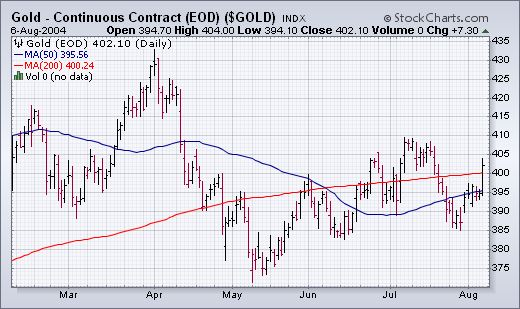
under its 200-day line as well. The drop in the dollar pushed gold $7.30
higher and back over $400. Gold is also back over its 200-day average.
That made gold stocks one of Friday's few winners. [The only other winners
were rate-sensitive homebuilders and utilities].
EARLY 2004 SECTOR ROTATION WARNINGS... In my Thursday update,
I chastised economists for missing the threat from rising oil prices
earlier in the year, and made reference to earlier warnings that I had
published on the subject. I thought it might be useful to list a few
of those earlier messages, which discuss early sector rotation warnings.
Two themes you will see repeated over and over is that leadership by
energy stocks and underperformance by technology is a bad combination
for the market. I've repeated those same warnings in recent messages.
Those negative signs were written about as early as January and February.
You can access those Market Messages by clicking on "More Archived Updates" in
my Market Message section: --January 27: "Loss of Leadership From SOX
Index May Be Bad Omen for Nasdaq" --January 29: "Tech Continues to Lead
Market Lower -- Market Rotates to Consumer Staples" --February 4: "Loss
of Nasdaq Leadership Could be Bad for Market" --February 10: "Rising
Oil Is A Threat to Market" --March 10: "Sector Rotations Are Similar
to Spring of 2000 -- Why Energy and Consumer Staple Leadership Isn't
Good"
The AD Line is a cumulative measure of advances less declines within
a given group of stocks. For example, the S&P Large-Growth ETF (IVW)
has 335 stocks. If there were are 200 advances and 135 declines, then
the difference would be +135 (335 – 200 = +135) and this would
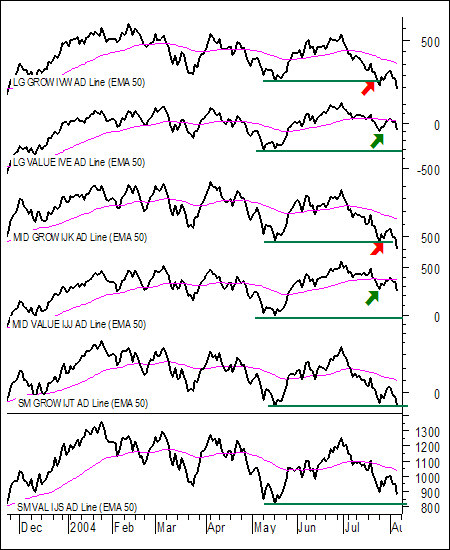
be added to the cumulative AD Line. The chart below shows the AD Line
for the six different style ETF’s.
Despite the decline over the last few weeks, the AD Lines for two styles
are holding up a lot better than the other four. Notice that the AD Lines
representing large-value and mid-value are holding well above their May
lows (green arrows). Conversely, the AD Lines for large-growth and mid-growth
moved below their May lows and remain the weakest of the six (red arrows).
Small-growth and small-value are holding above their May lows for now,
but are quite close to these important support levels and clearly weaker
than large-value and mid-value. Even though the overall market may decline,
these AD Lines suggest that large-value and mid-value will outperform
(advance more or decline less) than the other four styles over the next
few weeks and months.

Recently, the price of crude oil has taken the spotlight as having a
major influence on the price of stocks. On the one-year chart above we
can see that there was no consistent relationship between oil and stocks
as long as oil was priced below $35; however, when oil moved above $35
in March, we begin to see a consistent negative correlation between oil
and stocks.
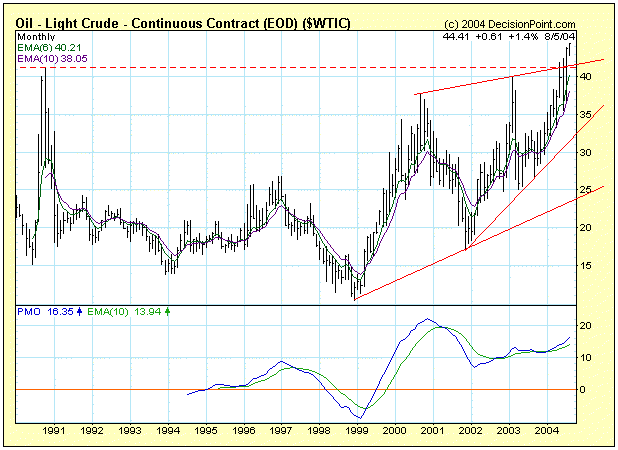
Long-term resistance for crude oil is around $41-42. When crude oil
reached that level at the end of July, stocks attempted another rally,
in anticipation that crude oil would turn down again at resistance. Once
crude broke to new all-time highs, the short rally in stocks failed.
If crude prices continue to move higher, I think we should be alert
for the possibility that there will be another disconnect in prices.
Specifically, if the price of crude moves well above $42, short price
declines may not translate directly to a rally in stocks because prices
will still be too high. This is not to say that stocks can't rally, just
that gyrations in the price of oil may not transmit directly to stocks.
For the record, I have no opinion regarding the price of oil. As you
can see on the long-term chart, it has moved into uncharted territory
and is above historical resistance levels. It could be headed for a major
blowoff, or it may have moved permanently into the bottom of a new long-term
trading range.
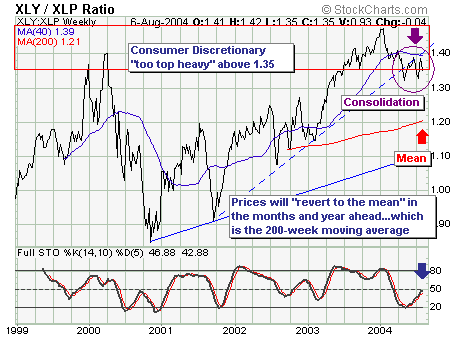
The weakness over the past several months is stark, which was made "more so" over the past two-day decline in all the major indices due to rising energy prices as well as a "punk" employment report. As a consequence of each of reports (and others) - our presumption is for consumer spending to remain weak in the weeks and months ahead...perhaps progressively becoming worse.
To understand this somewhat better, we turn to a very broad sector ratio we like to use - Consumer Discretionary (XLY) vs. Consumer Staples or (XLP). It goes without saying that if consumer spending is likely to weaken further, then consumer discretionary shares will weaken relative to the more necessary consumer staple shares. In fact, this has been occurring, but at still remains at historically high levels above 1.35. However, the emerging consolidation pattern below trendline resistance and the 40-week moving average argues for a new leg lower to have begun. If this is the case, then a move lower towards the 200-week moving average would be expected.
Hence, once again - it time to sell discretionary shares vs. staple shares, but remember...if a bear market has begun, then all shares are likely to decline...only the defensive staples shares will drop as quickly.
