Law #11: KEEP LEARNING
Law #11: Technical analysis is a skill that improves with experience and study. Always be a student and keep learning. - John Murphy
This may be THE most important law of all. The instant you think you've learned everything there is to know about Technical Analysis, the instant something new comes along and proves you wrong. There is always another chart to study, another book to read, another market commentary to consider. With the advent of the Internet, studying Technical Analysis could not be easier. Unfortunately, with so many choices out there, it can be quite overwhelming. Here are some additional places to go to learn more about Technical Analysis:
StockCharts' ChartSchool - Duh! ;-) Just click on the "Chart School" tab at the top of any of our pages and start reading.
StockCharts' Online Bookstore - We are constantly reviewing Technical Analysis books for you and only adding the good ones to our store. We also keep prices as low as possible for our users and always have an exceptional book on sale each month.
Our Public List Area - This is an often overlooked gem. It can help you in two different ways. First off, by reading the analysis of others and then comparing it with your own analysis, you will quickly become a better investor. Even if you completely disagree with what the other person is saying, you will still improve because you will be clarifying in your mind why you disagree with them.
The second major benefit comes when you start writing your own commentary for others. This is the #1 way to improve your charting skills. Don't worry if you are new to charting. Don't worry if you don't think your analysis is "good enough". Try any way. There's really no harm in trying and I honestly believe that publishing a public chart list will motivate anyone to become a better technical analyst.
TAAZ - http://www.equis.com/Education/TAAZ/ - This is the on-line version of a book everyone should have - "Technical Analysis from A to Z". Got a question that isn't answered on StockCharts? If it is about an indicator, chances are TAAZ has the answer.
Stocks And Commodities Magazine - Subscribe to this magazine. Read each issue cover-to-cover at least twice. Never throw out old issues. And buy the archived versions in paper or CD-ROM form. Keep them near your computer at all times. There are articles from issues published back in the mid-1980's that are still completely relevant today. This is another overlooked gem in my opinion.
Online Message Boards - Don't fear these things, use them! There are great message board areas for the discussion of Technical Analysis in both Silicon Investor (here)and InvestorsHub (here). Browse them. Read the archives. Ask questions. Post answers. Get involved. You'll be a better investor for doing it.
(A word of caution however: Never blindly believe anything you see on a message board until you are familiar with the people who are posting there.)
This conclude my series on John Murphy's 10 Laws of Technical Trading. Hopefully, these eleven articles have helped you expand your charting capabilities and helped you see how John's techniques can be applied in many ways. John and I both hope that you will continue to build on these "Laws" and use them to develop your own personal analysis style. Good luck!
Note: John's entire 10 Laws of Technical Trading can be found in our "ChartSchool" area under "Trading Strategies". If you missed any of my previous articles on Murphy's Laws, the ChartWatchers Archives page will take you to any of them.
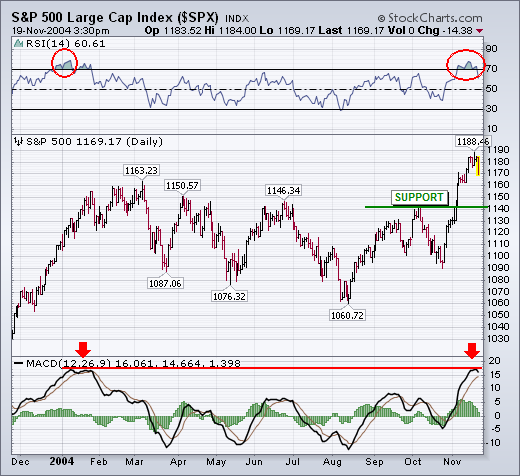
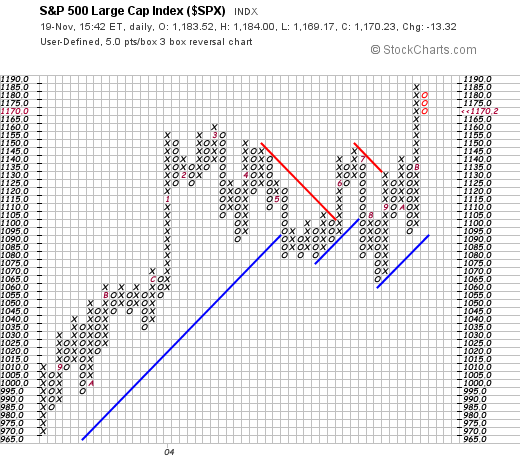
The daily chart for the S&P 500 for the last year pretty much tells the tale. The trend is still up. But its 14-day RSI line is in overbought territory for the first time since last January. Its daily MACD lines are also up against their early 2004 high. That being the case, and given today's negative intermarket trends, a pullback isn't too surprising. The key point is how much of a pullback do we need to start getting a little worried. One way to judge that is to look at where the previous peaks are. Working from the left side of the chart, that would put potential support points at 1163, 1150, and 1146 -- and the October peak at 1140, which may be the most important. That's because a pullback to 1140 would be a 50% retracement of the last upleg starting in late October and a 50% retracement of the entire upmove that started in August. As long as prices stay over that level, I'm not going to get too concerned. If it doesn't, I will. The point & figure boxes in Chart 2 also show that the S&P has suffered a three-box reversal into the down (o) column. That simply confirms that the market is entering a short-term pullback. So far, the p&f boxes don't show any serious trend damage.
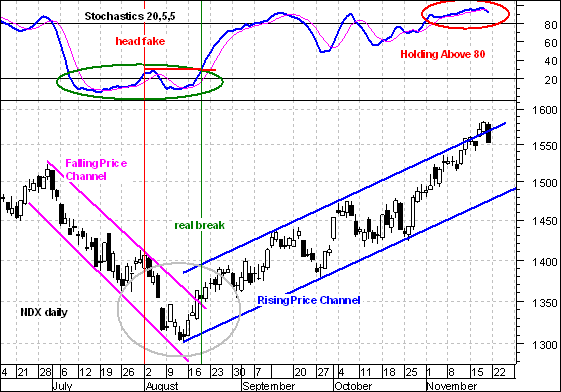
For an idea of how a FUTURE trend reversal might look, traders may wish to focus on the August low and think inverted.
The July-August downtrend was defined by a falling price channel and a Stochastic Oscillator below 20. Notice that the Stochastic Oscillator moved above 20 for a few days and then fell back (~ 1-Aug). This first attempt failed as both the indicator and index continued lower. The second Stochastic Oscillator break above 20 was accompanied by an index break above the upper trendline. In addition, the Stochastic Oscillator moved above its prior high. This signal stuck and the rest is history.
Looking at the current situation and applying recent inverted history, the first move below 80 could be a head fake and would likely occur with the index still above the lower trendline. The second move below 80 could be the one that is accompanied by a trendline break and the one that holds.
Why two moves? The advance over the last few weeks was quite strong and needs some time to unwind. Buying pressure is unlikely to dry up over night, just as selling pressure did not dry up after the July bounce. The first dip will entice buyers and this usually causes another run at resistance. It is the second decline that traders should watch. For now, the trend remains firmly bullish and this is just food for though on the future.
The market has finally broken out of the 2004 trading range, but many people are worried that the move could be a bull trap. One way to judge the authenticity of a move is to see how many stocks and/or sectors are participating in it. To do this we can look at the Percentage of PMM Buy Signals.
Decision Point's Price Momentum Model (PMM) generates longer-term buy and sell signals based strictly on price movement. (To learn more about the PMM click here ). We apply this model to all the stocks in a market index, then summarize the percentage of buy signals into an indicator.
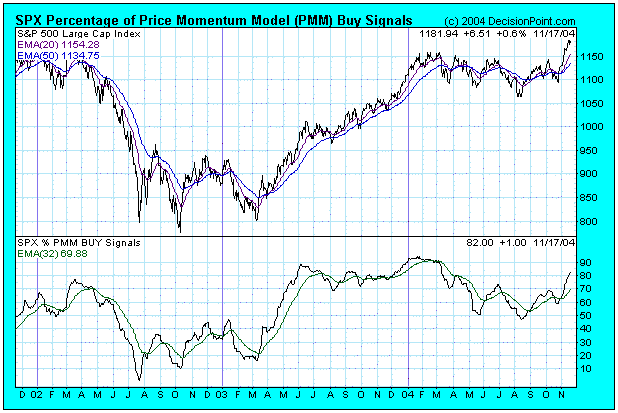
We can see on this chart that the Percentage of PMM Buy Signals for stocks in the S&P 500 Index is currently above 80%, which means that participation in this rally is quite broad, and that smaller-cap stocks in the index are participating as well as the large-cap stocks.
While a reading above 80% is good in terms of participation, it is also a level that we would consider to be overbought. This may or may not be a problem. In a bull market, conditions can remain overbought for extended periods of time, and prices can continue to move higher in spite of it. The last half of 2003 is a good example of this.
There is no practical way to guess how long this rally may last, but you will notice that the indicator was not seriously oversold when the rally began. The first leg of the bull market began when the indicator showed less than 20% PMM Buy Signals, whereas there were slightly less than 50% of PMM Buy Signals at the start of this rally. I interpret this to mean that, because the market was not seriously oversold at the start, this rally is not likely to last as long as the one in 2003.
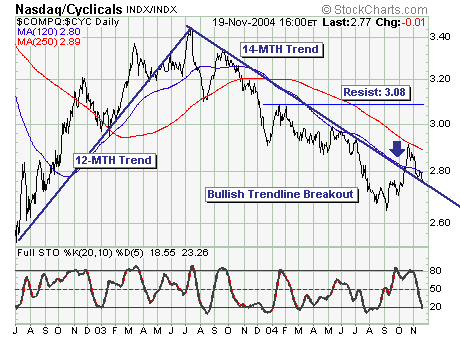
The recent rally to new highs in the S&P 500 large cap, S&P 400 mid-cap and S&P 600 small -cap is suspect. While higher prices may be offing in the near-term, we believe this rally could be terminal in nature given several divergences are evident. One of these divergences is the Nasdaq Composite/MS Cyclical Ratio ($COMPQ/$CYC); generally $COMPQ underperforms during a market rally as was evident from March 2003. However, $COMPQ has broken out against $CYC by moving above trendline resistance; this clearlyrings a bell' indicating the underlying tectonic plates are shifting; with an absolute trend change is not far off in the distance.
In the short-term, $COMPQ is pulling back in normal fashion to test trendline breakout. But, given the stochastic is oversolda turn higher is expected and for the ratio to resume its intermediate-term trend higher. Thus, if we are to be short into this recent rally we must clearly consider being short the cyclicals rather than technologywhich is counter intuitive technology is the higher-beta group.
