Happy Holidays! Welcome to this special holiday edition of ChartWatchers! This time around John explains why $40 is such an important number of Oil prices, Richard explains why he'd buy Coke but sell McDonalds, Carl has a chart that explains while Precious Metal prices are headed lower, and Arthur Hill looks at AMAT and MU. Here we go...
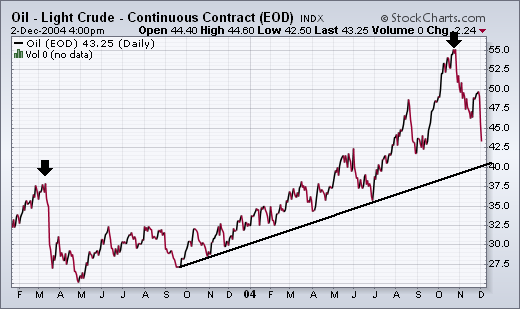
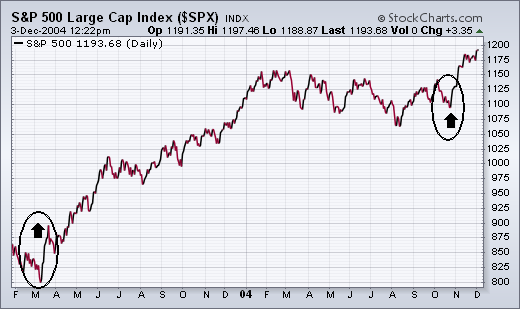
The last paragraph in the September 23 report carried the headline: LONG TERM IMPLICATIONS FOR STOCKS AREN'T GOOD. To repeat what I wrote then, "An October pullback in oil would probably be helpful to the stock market during the fourth quarter. The ability of oil to stay over $40, however, will remain a drag on the stock market and the economy...and will probably limit stock market gains during 2005". So far, the October top in oil (and this week's downturn) has been bullish for stocks and fits into the idea of a fourth quarter rally lasting into the start of next year. The longer-term picture is still in doubt. If this is just an intermediate correction in oil, and if oil starts to rise again next year from $40 (as I suspect it will), the stock market could run into trouble. That's another reason why $40 crude is such an important number. In case you're wondering if oil really has an impact on stocks, take a look at the last two charts. The peak in oil during March 2003 (at the start of the second Iraq war) coincided exactly with a major bottom in the S&P 500 (see first arrow). The second peak in oil this October (see second arrow) helped launch the latest S&P 500 upleg. Right now, the drop in oil is working in the stock market's favor.
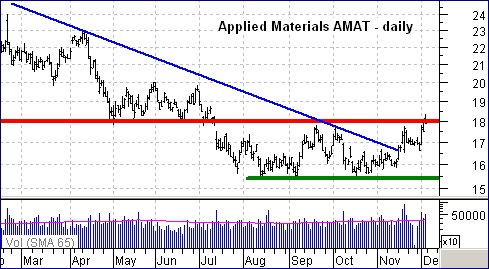
While the Nasdaq trades near a 52-week high, the Semiconductor HOLDRS (SMH) remains well below its Jan-04 high and has shown relative weakness over the last few months. There is also a split within the group as Applied Materials challenges resistance and Micron Technology (MU) tests support. Until both get on the same page, the Semiconductor group is likely to remain in a funk and continue underperforming the Nasdaq.
Applied Materials (AMAT) formed a double bottom over the last few months and is testing key resistance around 18. The double bottom represents a base over the last few months with support at 15.5 and resistance at 18. A break above 18 would confirm the pattern and the upside target would be around 20.5. Upside volume has been rather strong lately and this increases the chances of a breakout.
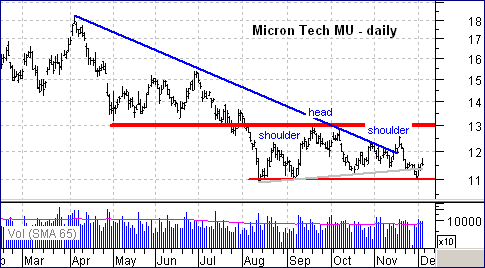
While AMAT is challenging resistance, Micron Technology (MU) is testing support and formed a potential head-and-shoulders over the last few months. This pattern is mostly associated with reversals, but can also signal a continuation. A move below neckline support would signal a continuation lower and project further weakness to around 9. Should MU hold support at 11, look for a break above 13 to ignite the stock and the Semiconductor HOLDRS.
When there is weak cash flow into Rydex Precious Metals Fund it is a fairly reliable warning to expect price weakness in the short-term, and sometimes the corrections can be quite severe.
As a general rule we expect cash flow to more or less follow prices -- when prices are going up, cash flow should also be moving up proportionately -- however, when prices rise and cash flow suddenly dries up, it tells us that the sector is losing support. Higher prices are failing to attract more money.
On the chart we can see four negative divergences between cash flow and price. In the first three instances they resulted in price declines. The current divergence seems to be playing out as expected and a correction in precious metals stocks has begun.
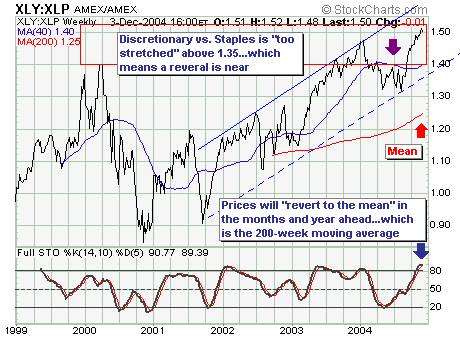
Today we look at the high relative valuation of Consumer Discretionary vs. Staples stocks. Current levels have not been seen; at the 2000 high in which the bubble burst', the ratio stood near 1.40. We believe that this stretched valuation' argues for one to reassess their portfolios in terms of the shares within them. To move into Staples would imply a defensive move' related to a decline in the overall stock market. While that may not be today's or tomorrow's businessone must be cognizant of the high probability discretionary stocks will not outperform from this point forward.
If we are correct, and we must be buyers' then we must consider the largest holdings in each group. If we must be long: Altria (MO), Anheuser Busch (BUD), Coca-Cola (KO), Colgate Palmolive (CL), Gillette (G), Kimerbly Clark (KMB), Pepsico (PEP), Proctor & Gamble (PG), Wal-Mart (WMT) and Walgreen's (WAG). Conversely, we would be sellers of: Carnival (CCL), Comcast (CMCSA), ebay (EBAY), Home Depot (HD), Lowe's (LOW), McDonald's (MCD), Target (TGT), Time Warner (TWX), Viacom B (VIA.B) and Walt Disney (DIS). It may seem counter intuitiverelative performance is important.