Our first issue of 2005 kicks off with a great summary of the recent S&P action by John Murphy. Richard Rhodes then looks at last week's correction. Carl Swenlin examines the recent change in investor sentiment and Arthur Hill wraps things up with a look at the US Dollar. OK, here we go...
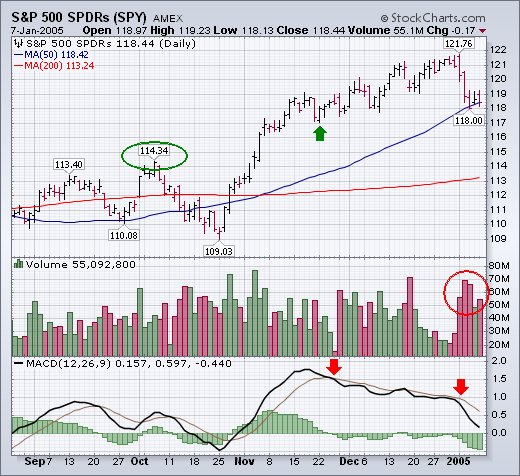
The S&P 500 ended the week with a loss of nearly 30 points (-2.4%). According to the historical record since 1950, a down close during the first week of January by the S&P 500 has resulted in a down year 45% of the time. A loss for the entire month of January raises the percentages for a down year to 58%. The good news is the the S&P 500 SPDRs (SPY) are still trading over their 50-day moving average. The bad news is that the Nasdaq market and the Russell 2000 Small Cap Index closed beneath that support line. Those were the two groups that led the market higher during the second half of 2004. They're now leading it lower. Also of concern is the volume pattern during the week. The biggest (red) volume bars took place during the four days while prices were falling. The smallest (green) volume bar took place on Thursday when the market managed a modest bounce. That means there's a lot more downside volume than upside volume. And that's not a good sign for the market. Daily indicators like the MACD lines have turned negative. [The weekly and monthly lines are still positive, but weakening]. If the S&P cracks its 50-day line, the next support shelf sits at 117 (see green arrow). The most significant support level on the chart is the early October peak near 114 (see green circle). Any close beneath that level would, in my opinion, significantly weaken the long-term picture.

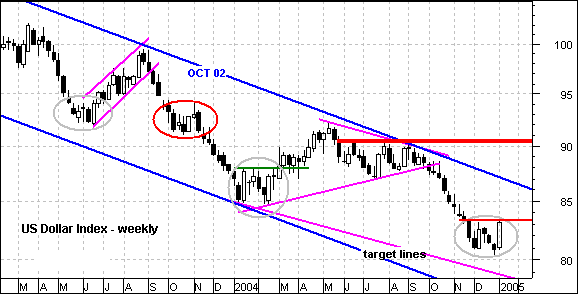
The Dollar may be giving us something to talk about…. and possibly even worthy of a short-term play. The US Dollar Index has consolidated for 4-5 weeks and formed long white candlesticks twice. These show strong buying pressure and, at the very least, reinforce support just above 80.
Notice that the index reversed course twice before with similar consolidations (gray ovals) and failed once (red oval). A move above 83.5 would be the bullish trigger and open the door to 87-88. Resistance at 83.5 is marked by the highs of the two long white candlesticks. As long 83.50 holds, the bears rule and this may keep from falling.
Even though a breakout would be quite positive, it would still be within the confines of a larger down trend. At this point, the long-term onus is on the bulls to prove the bears otherwise. This would take a trendline break and move above key resistance at 90.51. Therefore, the most we can expect currently is a corrective rally within a larger down trend.

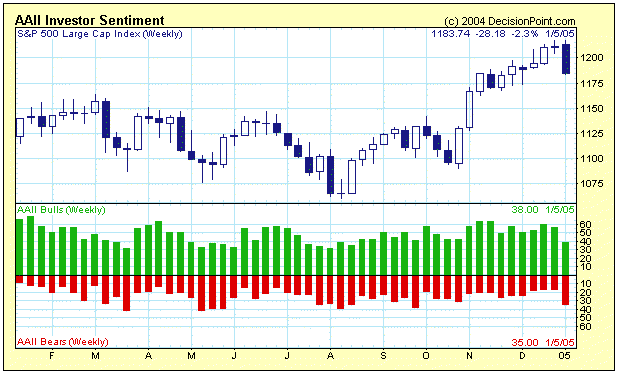
There has been a lot of concern among analysts that sentiment has been too bullish; however, the recent correction has done a lot to alleviate that condition.
The American Association of Individual Investors (AAII) performs an electronic sentiment poll every week. The cutoff is Wednesday and the results are published the next day. This quick turn around gives us an immediate view of investor sentiment before the results are stale and we can compare the results directly to the price action that generated them.
As you can see on the chart below, the recent price decline has effected a rapid attitude adjustment in investors, moving sentiment readings from very bullish to about neutral. Sentiment generally becomes more bullish as prices rise, and more bearish as prices decline, so it is a good thing that sentiment adjusted so quickly -- persistent bullishness in the face of price weakness would be unusual and a reflection of extreme complacency.

The Investors Intelligence advisor poll (not shown) has not yet reflected any response to the price correction, but this is because there is about a two-week delay from the time the advisory newsletters are written and the time the poll results are published, so it is too early to tell if newsletter writer sentiment has been affected.
It is important to remember that sentiment is a short-term indicator. For example, participants in the AAII poll are responding to this statement: "I feel that the direction of the stock market over the next 6 months will be: Up, No Change, or Down." We can see that investors' outlook for the 6-month time frame was significantly altered by a relatively small and short price decline.
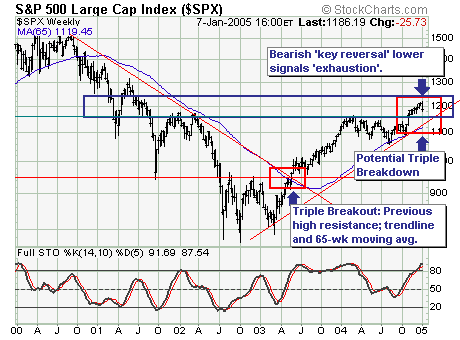
Last week's stock market correction was significant in our opinion; for the technical patterns suggest the correction will continue in the weeks ahead. But more significant in the fact that if the correction extends sufficiently below certain levelsthen the entire rally cycle off the October-2002 is complete.
First and foremost, last week formed a bearish key reversal' lower that signals exhaustion from within the 50%-to-60% correction zone; this increases the probability of a test of the 1165 level, which is a mere 21 points lower. Thereafter, if extend lower through this level and then trendline support and the 65-week moving average then we must consider the rally phase complete. If this scenario doesn't materializethen obviously higher prices will develop; but given a rising interest rate environmentthis seems a fairly remote probability.
In any case, the most important trading decisions will be made regarding long/short sector rotation; this will be the key to outperforming the indices in 2005.
