2005 is well underway now and some important technical trends are developing on the year-to-date charts.

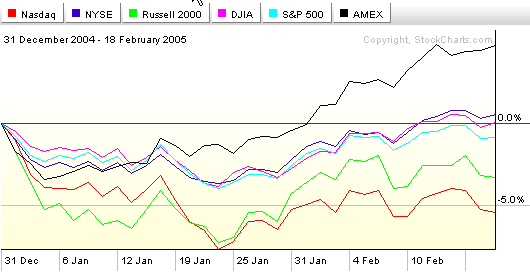
As you can see on this PerfChart, since the start of the year, the energy-heavy AMEX index has outperformed the other benchmarks significantly. The Dow, the NYSE, and the Large-Caps are clustered around the break-even point and the small-caps and tech-heavy Nasdaq have both had significant losses so far.
Will these trends continue? And if so, for how long? These are the questions that our commentators try to get a handle on during the rest of this issue. First, John Murphy
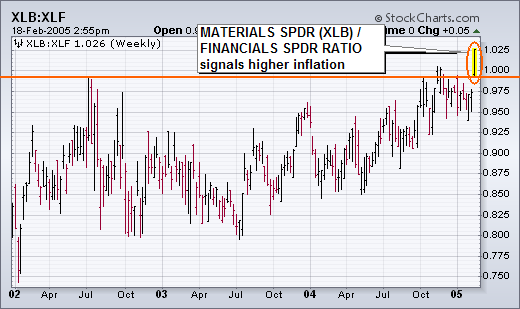
At the New York Expo last weekend, Martin Pring made the case that the battle between the forces of deflation and inflation had reached a critical inflection point. In other words, his charts showed that the deflation/inflation scale was about ready to tip in one direction. He arrived at that conclusion by comparing rate-sensitive (deflation) stocks with commodity-related (inflation) stocks. When rate-sensitive stocks are in the lead, deflation is dominant. When commodity-stocks lead, inflation is dominant (or becoming so). Which brings me to our last chart. It's a ratio comparison of basic material stocks to financials. With long-term rates rising this week, and inflation and commodity prices picking up, the week's strongest sectors were basic materials and energy. The weakest sector was financials. The chart below is a ratio of the Materials ETF (XLB) divided by the Financials ETF (XLF).

MATERIALS/FINANCIALS RATIO TURNS UP ... The fact that the ratio has been trading sideways for almost two years shows that deflation/inflation forces have been pretty evenly balanced (as the Fed has been pointing out). This week, however, the XLB/XLF ratio broke out to the highest level in three years. That tells me that the scale has finally tipped in favor of inflation. If inflation is no longer contained (as the Fed has claimed) it may have to abandon its "measured pace" and raise short-term rates faster and longer than it had planned to. Rising inflation expectations could boost long-term rates. All of these trends have important implications for investors. For one thing, it'll be better to be in inflation-sensitive stocks (like basic materials) than deflation-sensitive stocks (like financials). It also hints at higher interest rates -- both short and long. All of which seems to strengthen my negative view on the stock market and my preference for cash, commodity-related stocks, and defensive stock groups in general.
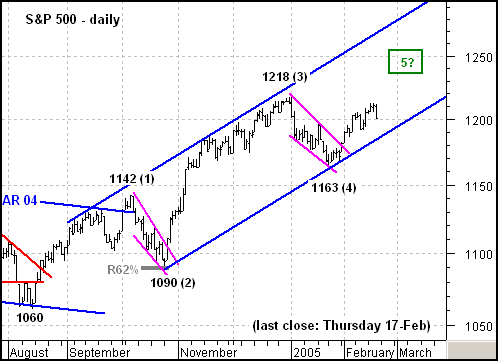
The S&P 500 remains in bull mode and continues to outperform the Nasdaq 100. In Elliott terms, the index has taken on a 5-Wave structure since mid August. Wave 1 extends up to 1142, Wave 2 declined to 1090, Wave 3 advanced to 1218 and Wave 4 fell to 1163. The recent move above the upper trendline of the falling wedge represents the beginning of Wave 5.
As a Wave 5 advance, the upside projection would be to around 1240-1245. Wave 5 is often 62 percent of Wave 3 or equal to Wave 1. The 62% stems from the Fibonacci number .618. As a Fibonacci 62% of Wave 3, the upside target would be to 1242 (1218 – 1090 = 128, 128 x .62 = 79, 1163 + 79 = 1242). Should a repeat of Wave 1 occur, the upside target would be to 1245 (1142 – 1060 = 82, 1163 + 82 = 1245).
Regardless of the targets, Wave 5 should move above the high of Wave 3 (1218). As long as the blue trendline extending up from the late October low holds, the bull trend is firmly in place and further strength should be expected.

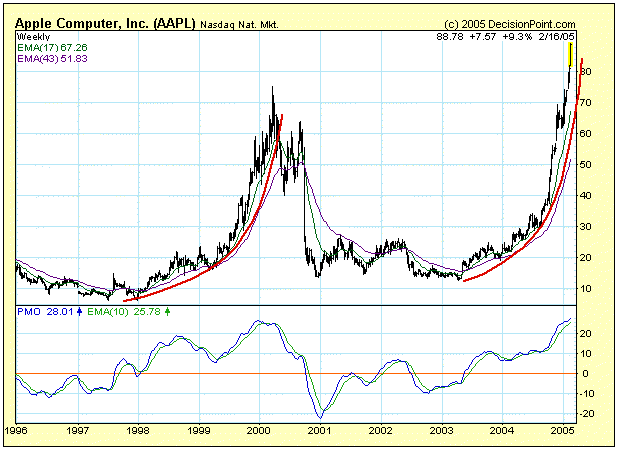
Investors love the Apple (AAPL) "story" and they are driving he stock's price into a vertical ascent. When a stock arcs into an ever-increasing angle of ascent it is called a parabolic rise. "Investors" get into a feeding frenzy, causing the price rise to become so steep that it is unsustainable. The inevitable outcome of a parabolic is a crash, because investor sentiment will at some point reverse, and people are suddenly trying to get out of the stock as fast as they were previously trying get in.
What is at once amusing and tragic is that, as you can see on the chart, this isn't the first time this has happened to AAPL. Nevertheless, here we go again. One piece of recent news that has propelled the stock is the announcement of a 2:1 split, and coincidentally there was also a 2:1 split in 2000 as well. Those who fail to learn from history . . .
Another driving force behind parabolics is short sellers. Their suicidal attempts to pick a top followed by frenzied short covering creates even more demand to drive the price higher. It is foolhardy to play parabolics in either direction.
I don't know when this parabolic will finally collapse, but it is virtually guaranteed that it will. (Note that the PMO is very overbought, a sign that the end is probably near.) Once that happens, prices can return to their starting point (or close to it). Another less disastrous outcome is that about 50% of the parabolic gains can be lost, then the stock enters a high-level consolidation for several years.
Personally, I think Apple is a good company, I love their products, and in my opinion the company's prospects today are better than they have been in years; however, the current price behavior reflects unrealistic investor expectations.
