With the markets down for the past three days, the Internet is all abuzz with predictions and prognostications about what's going to happen next. As you try to sort it all out, remember that charts don't lie. Charts don't have an agenda. And charts might be your only friend right now. OK, OK, charts AND our crack team of market commentators. Read on to see what John, Richard, Carl and Arthur have to say about last week's big happenings...
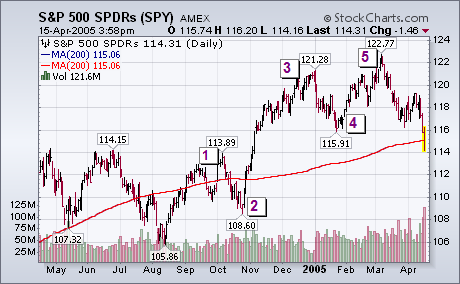
After this week's breakdown, there can be little doubt that the cyclical bull market that started in October 2002 has ended. The question now is how far down can the market drop. The daily bars in the chart below show the S&P 500 SPDR breaking its January low and closing beneath its 200-day moving average. Downside volume was very heavy. There's a support level at 108.60 at its late October low. But I think the S&P (and the other major stock averages) are headed all the way back to its August low. That's based partially on standard chart analysis, and partially on Elliott Wave Theory. The chart shows that the rally off the August low took place in five waves. The breaking of the bottom of wave 4 (the January low) confirmed that the rally ended. But there's another Wave 4 to consider.


The current pattern at work in the Nasdaq looks quite similar to prior patterns for the S&P 500 and Dow Transports. Both of these indices had extended advances, failed to hold a breakout to new highs, broke trendline support and then continued to support from the prior low (1163 and 3454). In fact, the S&P 500 and the Dow Transports continued lower on Friday and broke below their prior lows. The patterns looks like large double tops and the support breaks are quite bearish.

Turning to the Nasdaq, we can see that a similar scenario projects a move to around 1750. This would also make for a large double top and a break below 1750 would further the bearish argument.

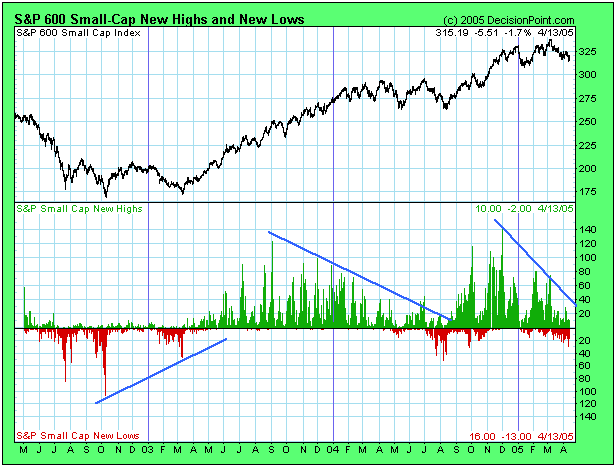
At DecisionPoint.com we have recently added a chart of S&P 600 Small-Cap 52-week new highs and new lows (NHNL). (We also have NHNL charts of the S&P 500, S&P 400 Mid-Cap, NYSE, and Nasdaq). This allows us to examine and determine the condition of each sector.
As with other indicators, we look for divergences between the indicator and prices. New lows are particularly good for identifying long-term bottoms. Note the sharp contraction of new lows in March 2003 compared to October 2002 associated with price lows that were about the same. This positive divergence was a good sign that the bear market decline was ending.
From March 2003 new highs began to expand until they peaked in September 2003. From there they began to contract and continued to do so for almost a year. So why didn't this negative divergence signal a major price top? Primarily because in a bull market negative divergences are very unreliable.
One way we can determine if a contraction of new highs is probably meaningless is by observing what is going on with new lows. Note how between September 2003 and August 2004 there was virtually no expansion of new lows until the end of the period when the bull market correction climaxed.
Next we can see how new highs peaked in December 2004, and they have been contracting ever since. This time we can see that the angle of contraction is much steeper than the previous one, and, more important, there is a visible and persistent expansion of new lows. The negative divergence of new highs along with the expansion of new lows is one sign that the bull market may be over.

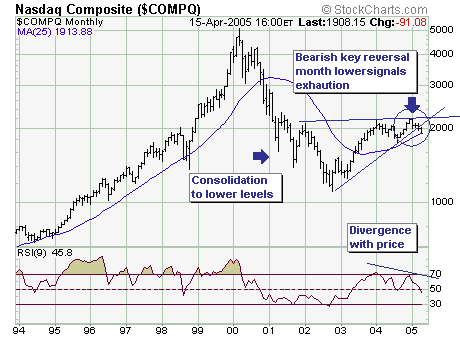
From Tuesday's close last week; the Nasdaq Composite ($COMPQ) has declined in mini-crash' fashion: down -4.8%. The question is whether there are further declines ahead or whether a sustainable rally will develop back towards the highs or even new highs. An instructive chart to this end is the monthly chart; which shows a major bearish consolidation after the 2000-2002 declines. In fact, trendline support was recently violated, with the next to last support' to be tested being the major 25-month moving average the other being the 2004 low.
Friday's trade broke below this moving average by 5 points; any further deterioration would certainly not suggest higher future prices. We very well may see this level hold given short-term oversold conditions, a countertrend rally develops and then a later date moving average failure. Or, this level holds and prices turn higher on a multi-month crusade. All are plausible outcomes, although we accord a higher probability to the first two.
Thus, a fulcrum point is at hand, which increases whipsaw risk but it will also solidify our questions about the next larger move in either direction. In our opinion, one simply should use rallies to put on short positions in the proper technology sectors/industries.
