At the end of August, a very promising thing happened on the Dow Jones Industrials chart. Did you see it?
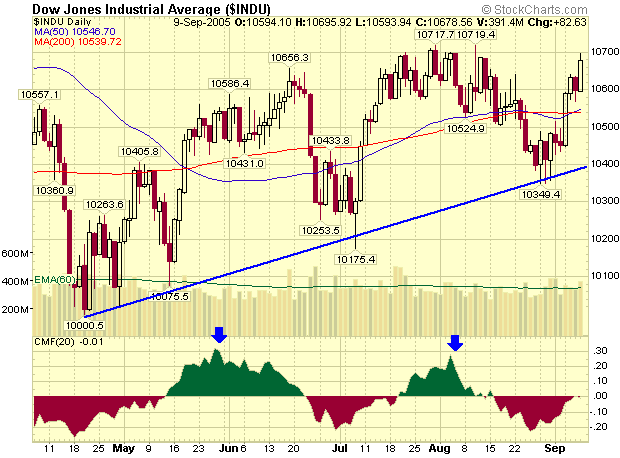
Last Thursday the index reversed around the 10,350 level. That confirmed the intermediate term uptrend (blue line) that goes back to the 10,000 low from last April. During this uptrend there have been two cycles between the three troughs - those peaks are clearly shown on the Chaikin Money Flow graph (blue arrows). If this pattern continues, expect to see the market rise until the CMF turns lower in a couple of weeks. But watch this chart closely folks! This week's test of 10,700 is key.
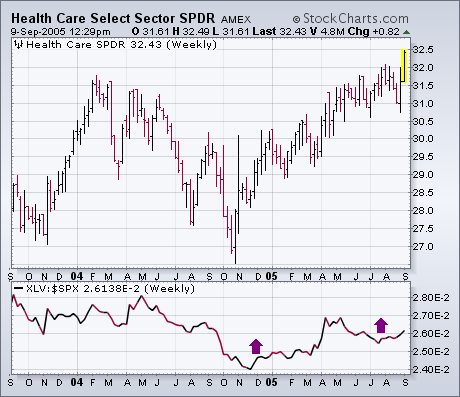
Some of you may have watched my 7:10 am interview on Bloomberg TV Friday. I discussed the upside breakout in the healthcare sector that I wrote about earlier in the week. For those of you who missed it, however, I'd like to show the same charts that we used on the air to make my point more clearly about the activity within the healthcare group itself. The chart below shows the Health Care Select SPDR (XLV) closing above its early 2004 peak this week to achieve a bullish breakout. [It's now challenging its 2000 peak]. The rising relative strength line since the end of 2004 shows that healthcare has been a market leader year (along with energy and utilities). The point I made this morning was that the XLV provided a vehicle for buying the entire healthcare sector. But there were two other ETFs that also provide exposure to the healthcare group in biotechs and drugs.
Dow Theory stipulates that the Dow Industrials and Dow Transports should confirm each other to validate weakness or strength. Most recently, both Averages recorded new reaction highs in late July (green arrows) and this provided a Dow Theory confirmation of strength. Both Averages corrected in August, but only one surged in September.
The Dow Transports formed a falling flag correction in August. The only problem, for the bulls at least, was the inability of the Average to break the fall, exceed resistance at 3706 and signal a continuation higher. The flag just kept on falling and the Average gapped down on Friday.

In contrast to the Dow Transports, the Dow Industrials firmed around 10400 with a couple of bullish candlestick reversal patterns and surged above 10600 with a big move over the last four days. Wednesday’s long white candlestick is enough to confirm the prior bullish engulfing (30-31 Aug) and turn the Dow Industrials short-term bullish.
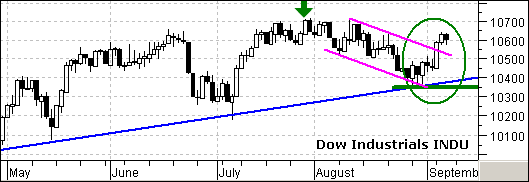
The Dow Industrials surged and the Dow Transports sank – something is wrong with this picture. This amounts to a non-confirmation of strength in the Dow Industrials. The Dow Transports need to break resistance at 3706 to get the Dow Theory bull back on track. Without confirmation from this economically sensitive group, the breakout in the Dow Industrials is prone to failure.
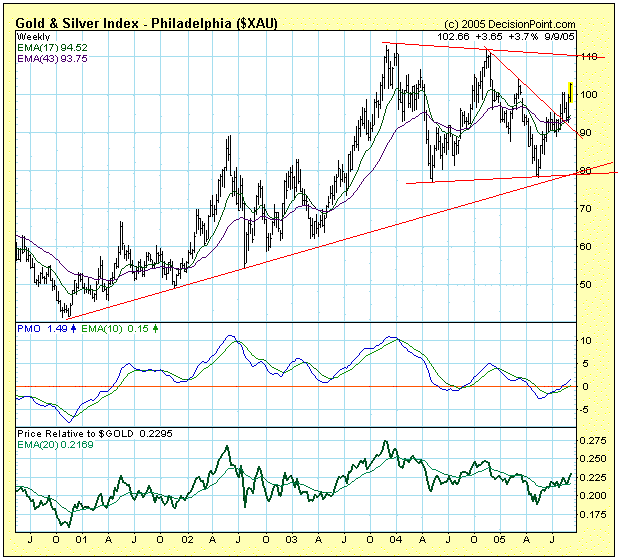
The May low for the Philadelphia Gold and Silver Index (XAU) provided us with the second data point necessary to establish the bottom of a trading range that is about two years old. The XAU is now approaching the top of the range, and we can expect that the current advance will stall when that overhead resistance is reached.
Trading ranges are also called continuation patterns. This is because they are formed when the trend of a price index pauses to consolidate before the trend continues. Since the XAU trend was rising before the consolidation began, we should expect the trend of the XAU to continue upward once the current trading range runs its course.
Our expectations regarding the trading range are also supported by the internals. The PMO (Price Momentum Oscillator) is rising and above its 10-EMA, and it has plenty of room to run before an overbought condition is reached, so the next test of resistance could ultimately result in an upside breakout.
A final note, the bottom panel of the chart shows the relative strength of the XAU to the price of gold. If gold and gold stocks always had the same percentage of change, the price relative line would be flat; but this is clearly not the case. When the line rises, it means that the XAU is stronger than gold (and vice versa). As you can see, the XAU normally moves in the same direction as gold, but at a faster rate of speed.
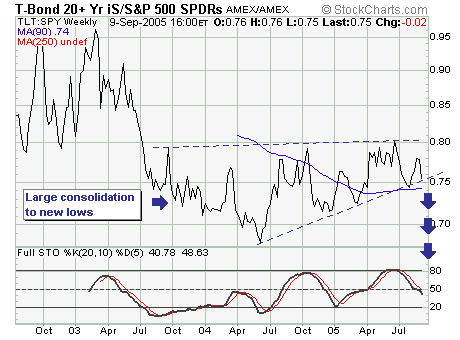
With the passing of Hurricane Katrina, we want to hone our focus in upon the TLT:SPY ratio relationship. This is simply due to the enormous amount of local, state and federal debt issuance that will materialize due to the substantial nature cost of clean-up and reconstruction efforts of the Gulf Coast area. Also, there are concerns about the inflationary prospects for many building materials. So from a fundamental point-of-view we want to be a seller of bonds as we believe issuance/inflationary concerns will outweigh all economic weakness concerns.
The TLT:SPY ratio seems to bear this out, with bonds set to continue their downtrend against stocks as a 'midpoint consolidation' is rather clear on the weekly chart. Moreover, if one believes the market is in a "topping pattern" such as we do then if stocks are to decline in any way shape or form then TLT is likely to decline even more sharply. Thus, if one wants to be short with any type of confidence, we suggest being short TLT.
