This week, John reviews the market's recent performance in light of all the economic changes we've been seeing, Richard breaks out a new triangle pattern, Carl takes an in-depth look at gold, and Arthur Hill looks at the Russell 2000. Here we go...
MARKET AVERAGES CLOSE BACK OVER 50-DAY LINES...
The market had a lot thrown at it this month. A spike in energy prices,
plunging consumer confidence, and rising long-term interest rates. It
also had the month of September to deal with which has traditionally
been the worst month of the year. While the market bent a bit during
the month, it refused to break. And then ended the month on the upside.
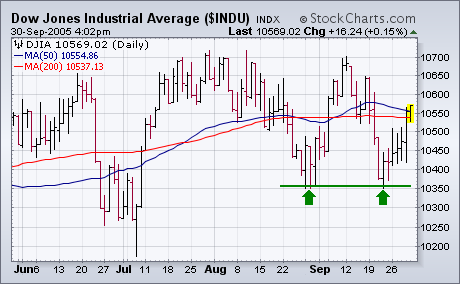
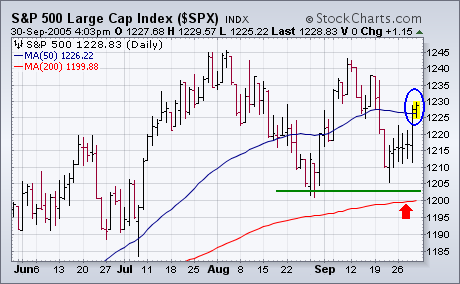
The first three charts show essentially the same pictures. The three
major market indexes held support at their late-August lows and closed
the week back over their 50-day averages. [The S&P and the Nasdaq
also stayed over their 200-day averages]. That action prevented a chart
breakdown and has kept the market in a trading range. This week's
bounce also kept weekly and monthly indicators in positive territory.
Part of Friday's market gains were probably the result of falling
energy prices. Some other positive signs were new signs of strength in
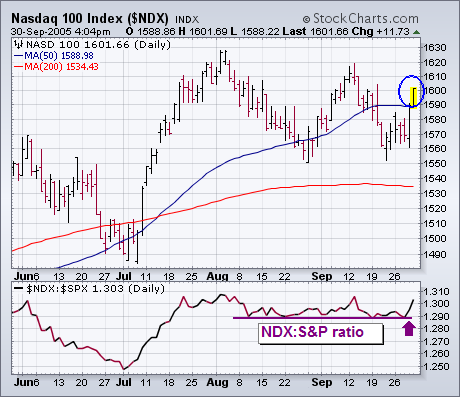
small caps, the Nasdaq, semiconductors, and the transports. Chart 3
plots a ratio of the Nasdaq 100 divided by the S&P 500 .
The ratio peaked in early August when loss of Nasdaq leadership started
to weigh on the entire market. The good news is that the ratio started
to bounce again this week (see arrow). The market usually does better
when the Nasdaq shows upside leadership. A lot of the Nasdaq leadership
came from the semiconductors.
- John Murphy
The Russell 2000 ETF (IWM) has two potentially bearish patterns
working that would be confirmed with a support break at 64 (645 for the
Russell 2000). Confirmation is the key with both patterns. In fact,
confirmation is the key to most patterns. Until confirmation, these are
only potentially bearish patterns and a trend reversal has yet to take
place.
The descending triangle usually marks a
continuation of a downtrend, but can also mark a top. The lower high
(red arrow) shows that buyers do not have as much power as before and
upside momentum is waning. However, the equal lows represent support
and show that the sellers have yet to take full control (green arrows).
A support break would signal a new thrust of selling pressure and
confirm the bearish pattern. The downside projection would be to around
60 and broken resistance from the April-May highs confirms this level.
The
second potentially bearish pattern involves three fan lines. These
extend up from the April low and the stock already broke the first two.
IWM has consolidated since breaking the second fan line and a move
below the third would confirm this bearish setup. Notice that the third
fan line and descending triangle lows confirm support around 64 and it
is clear that a break below this level would be most bearish.

- Arthur Hill
This chart of gold has some interesting technical features. First,
there is the parabolic rise to $850 in 1980, which culminated in the
inevitable blowoff and collapse.
After a
parabolic collapse, prices most often return to the original base,
which in the case of gold is somewhere below $100 and not visible on
the chart; however, another outcome is that prices can enter a
high-level consolidation, which is a trading range at a level far above
the previous base, and this is what has happened with gold. In this
case, the trading range is between roughly $300 ($250 at the extreme)
and $500, and it serves the purpose of digesting the excesses of the
parabolic, and preparing for the next long-term move, which I assume
will be up.
The reason I assume that the next long-term trend will
be up is because the double bottom in 1999 and 2001 marks the end of a
22-year bear market in gold, and a new bull market is in force. The
problem is that the bull market is now nearly five years old, and we
can clearly see overhead resistance in the area of $500, created by the
intersection of the top of the rising trend channel and the top of the
long-term trading range.
The normal technical outcome from a high-level
consolidation is an upside breakout. We don't know if the current
rising trend will be able to effect such a breakout, but sufficient
time has passed that it would not be overly optimistic to have this
expectation; however, remember, we are looking at a monthly chart (each
bar is one month), and it could be another year or more before a
breakout is made and confirmed.
For example, there were corrections within the rising
trend channel in 2004 and 2005 that took several months to complete, so
it is reasonable to expect that another lengthy correction will take
place once the resistance around $500 is encountered.
Finally, let's look at the Price Momentum Oscillator
(PMO). The PMO peak in 1980 is abnormally high and cannot be used as a
benchmark for anything except another parabolic rise. The PMO's current
level is typical for the trading range, but it is pretty high. This
level could be exceeded if the rising trend continues and accelerates,
but, if gold's current rate of climb is maintained, the PMO can remain
flat, and, therefore, not much help in warning of a trend change.
Bottom Line: My long-term view for gold is positive, but
I expect that, when it encounters the resistance at the $500 level,
there will be a correction of sufficient length and depth ($450?) to
consolidate the gains of the last five years and to move the PMO back
toward the zero line.
- Carl Swenlin
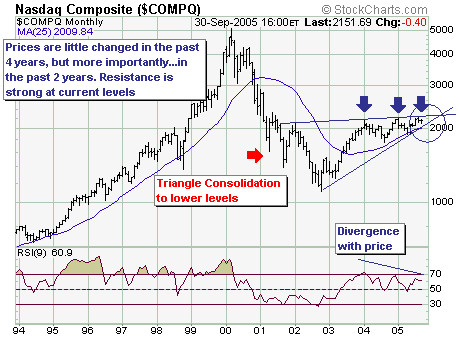
Taking a long-term gander at the Nasdaq Composite, I think is very
clear that the time is running out for prices to rise much further than
they have at present. The reason is that prices are winding their way
through the "triangle consolidation"; which means two scenarios exist –
a bearish and bullish one to be exact. The bearish probability is
highest in my mind with prices breaking down through trendline support
and then the 25-month moving average currently at 2009 – thereby
‘confirming' a bear market has begun; or the lower probability breakout
above major resistance at 2185-2200 – this would signal a new and
larger leg higher is underway.
Given
our stance is clear, it is so only because our longer-term models show
the current rally's 'strength' has moderated significantly to where
selling pressure is rising a sharp rate than in previous months.
However, our shorter-term models are turning higher - which against the
backdrop of our longer-term high probability scenario suggests a rally
in the next several weeks that will be a 'final and material test' of
the highs will occur and then fail with lower prices back towards
1200-1500 anticipated.
But the real cruxes of the situation will which themes to be involved in.
Performance
ETF Portfolio: +7.0%
"Paid-to-Play" Portfolio: +14.3%
- Richard Rhodes


