Have you tried SharpCharts2 yet? The reception for our new "Beta 7" version of SharpCharts2 has been incredible! More people have created more great looking SharpCharts2 charts in the past 3 days than ever before. And many of you have sent us lots of wonderful feedback about what they liked and didn't like about the changes we have made. And that in turn has allowed us to make SharpCharts2 even better - it's truely a win-win situation.
In case you missed our mid-week mailing, the "Beta 7" version of SharpCharts2 will be our last unofficial release of SharpCharts2. It create charts that are far superior to our current SharpCharts and allows more charting flexibility than anything else out there on the web. Overlays, extra bars, three line break charts, multiple ticker symbols, annotations, additional indicators, more color choices and much more are available via SharpCharts2. All of our users owe it to themselves to check it out soon!
The Beta 7 version of SharpCharts2 also allows our Basic and Extra members to get a preview of what life will be like when SharpCharts2 is fully integrated into StockCharts.com. During the Beta, members can view any of their saved charts from inside the SharpCharts2 workbench. This lets you see what your saved charts will look like under SharpCharts2. The conversion process is automatic - simply select your charts from the dropdowns just like you do with SharpCharts1.
In addition, Extra members can now save new SharpCharts2 charts into a special list that has been automatically added to their account. The list is called "SharpCharts2 BETA" and can only contain SharpCharts2 charts. During the Beta period, this is the only list that new SharpCharts2 charts can be stored in - that will change however once SharpCharts2 is officially released.
Finally, Basic and Extra members can also create and store ChartSettings for SharpCharts2 in their account. This lets you quickly switch back and forth between several different styles of charts for the same ticker symbol. Keep in mind that the ChartSettings for SharpCharts2 are completely seperate from any store settings you may have for SharpCharts1.
Here are some more tips and tricks for using SharpCharts2 that we've collected from our users during the first 3 days of the Beta period:
1.) The Big Yellow Box Doesn't Go Away?
Click on the "Hide Box" link in the upper right corner of the box to hide it. If you have cookies enabled for our website, that box will stay hidden.
2.) I Can't Find the Advanced Pull-Outs Anymore?
The features provided by the Advanced Options pull-outs (color, opacity, etc.) are reserved for our paying members' use and are no longer available to free users. If you are a member and you don't see those features, please make sure you are logged in to our site correctly.
3.) I Can Only Add Three Indicators/Overlays to a Chart?
Again, free users are restricted to having only 3 indicators and/or overlays per chart. If you have saved a Beta 6 chart with more than 3 indicators on it, you will no longer see the addition indicators in Beta 7. If you are a member, make sure that you are logged in.
4.) Really Strange Things are Happening like Buttons Not Working When Clicked?
As we update our software, you need to make sure that your browser isn't using a cached version of the older code. Clear out your browser's temporary file cache whenever you see unexpected behavior. Instructions for doing that are on this page: http://stockcharts.com/FAQ-Config.html#Cache
5.) The Annotation Tool Doesn't Work?
Make sure that your computer passed our Java Troubleshooter tests: http://stockcharts.com/support/javaSupport/javaOne.html
6.) How Do I Import Old Charts into SC2?
Actually, you don't. During this Beta period, you can use the Beta 7 workbench to view your old saved charts, but you cannot use it to modify them. Extra members can save _copies_ of their old charts into the new "SharpCharts2 BETA" list if they want to make modifications by first pulling up the old chart in the Beta 7 workbench and then clicking the "Add New" link.
7.) Why Haven't You Responded to my Message?
We're swamped right now working hard to improve SharpCharts2 for everyone. Please excuse us if we do not get back to you immediately. In addition, please understand that we are not going to be adding new features to SharpCharts2 until well after it is officially released.
So what are you waiting for? Log in to your account and start using Beta 7 today!
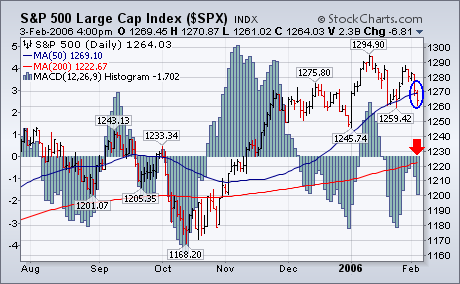
The chart below shows the S&P 500 closing the week below its 50-day moving average. That suggests a further drop toward 1245. The daily MACD histogram bars also paint a short-term negative picture. They stayed below the zero line and failed to confirm the previous week's price bounce before weakening even further this week. That only affects the short-term trend. It's the weekly trend that I'm more concerned about.
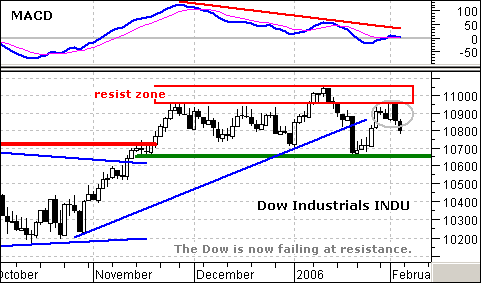
The Dow is meeting staunch resistance around 11000, a level that turned the Average back in December and January. February is getting off to the same start with a big black candlestick on Thursday and 11500 remains the level to beat. In addition to a failure at resistance, MACD has a large negative divergence working and is poised to dip into negative territory for the second time this year. Things are looking bleak for the Dow.
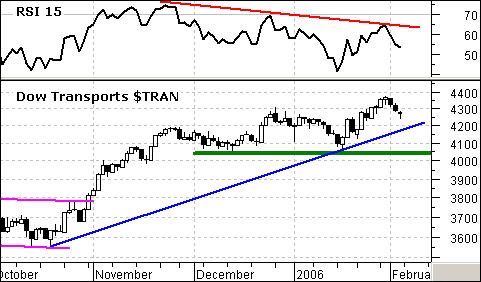
We also have a non-confirmation with the Dow Transports in January. The Dow Transports moved to a new reaction high in late January, but the Dow Industrials failed to exceed its early January high and formed a lower high. Despite strength in BA and UTX, the Dow Industrials is not as strong as the Dow Transports. This is a Dow Theory non-confirmation and a move below the January lows (both Averages) would provide a Dow Theory sell signal. Also notice that RSI formed a large negative divergence over the last few months and upside momentum is waning for the Dow Transports.
With the market having formed numerous tantalizing tops since the end of November, perhaps the title of this article should say that a correction phase is finally beginning. And, considering all those previous false starts, why am I so sure that this time is the real thing? Well, I'm pretty sure that a medium-term correction is in progress because the PMM Percent Buy Index (PBI) has turned down and crossed down through its 32-EMA. The PMM (Price Momentum Model) PBI is an important indicator that reveals the degree of bullish participation and whether that participation is getting stronger or weaker.
On the chart I have marked the current PBI top as well as three prior significant tops, which were also followed by 32-EMA downside crossovers. All three tops initiated a correction lasting from three to six months. There is no guarantee that the same thing will happen this time, but the similarity between the tops gives me a high degree of confidence in my conclusion.
The next chart shows our IT Breadth and Volume Momentum Oscillators (ITBM and ITVM), and you can see how the market's internal strength peaked about two months ago, and these indicators gave a similar early warning for the other three corrections.
The ITBM and ITVM show that the current market condition is neutral (the indicators are near the zero line), but it is likely that they will be spending a few months working below the zero line as the market begins to correct in earnest.
There is no way to tell if the correction will be sideways or sharply down, but we are due for a cyclical bear market, and the 4-Year Cycle is pointing toward a major price low in October, so odds are in favor of a significant price decline.
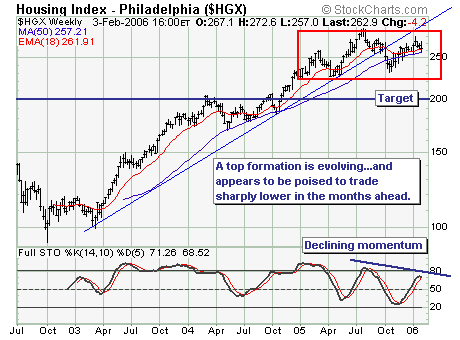
The decline in the housing market is becoming more and more real; however, the housing index has yet to fully reflect the risk of the potential for still slower housing growth numbers. In some cases such as Ryland's (RYL), new home sales were recently below 2004 levels. Thus, when we look at the Housing Index ($HGX), we find prices are now poised to correct their recent gains and still more. We foresee the index dropping from it's current 262 level all the way back to 200.
We are short the homebuilders, and we want to become shorter.