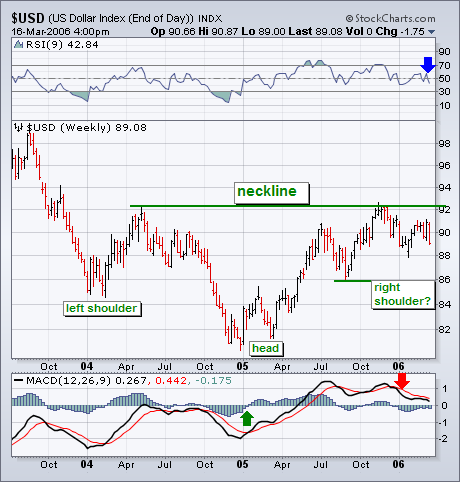
It's possible that the current dollar pullback is part of a large basing pattern of the head and shoulders variety. A case can be made that the Dollar Index formed a left shoulder at the start of 2004 and a head at the start of 2005. The fourth quarter peak near 92 stopped right at the spring 2004 peak. That allows for a neckline to be drawn over those two peaks. That interpretation allows for a drop in the USD to last summer's low near 86 as part of a possible right shoulder. That would be a fifty percent retracement of the 2005 price advance and would be a logical spot for new buying to emerge. Any severe break of last summer's low, however, would call into question the "head and shoulders" interpretation. On the upside, the Dollar Index would have to clear the "neckline" near 92 to confirm a long-term bullish breakout. Neither of those two events appears likely over the short-run. Even if the "head and shoulders" interpretation proves correct further out in time, the short-term picture for the dollar is looking weaker.
The dark cloud is a bearish candlestick reversal pattern made up of two candlesticks. The first is white and the second black. The open of the second is above the close of the first and the close of the second is below the mid point of the body of the first. The open-close range forms the body of the white candlestick. The thin lines above and below the body are called shadows and these represent the high and low.
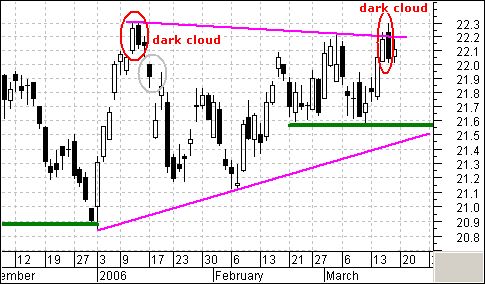
A dark cloud foreshadowed the January peak and this week?s dark cloud should be watched closely for confirmation. In January, the subsequent gap and move below 22 confirmed the dark cloud pattern (gray oval). The current dark cloud formed near the upper trendline of a triangle formation (magenta trendlines). There is stiff resistance around 22.3 and XLK must break through this level to confirm the triangle and project further strength towards the mid 20?s. This would be bullish for the Nasdaq and the S&P 500 as well. Failure and a move below the early March lows would be bearish for XLK and I would then expect a move below the January low.
Last week I wrote an article entitled Investors Intelligence Sentiment Helps Bulls in which I pointed out that sentiment had become very bearish, and that the market was more likely to rally than decline. Since then the market has enjoyed a short rally, but sentiment continues to be steadfastly bearish, a persistent positive for the market; however, the market has become short-term overbought and it has run into long-term resistance.
The bottom two panels on the first chart show the breadth and volume versions of the Swenlin Trading Oscillator (STO) -- short-term indicators. As you can see, both indicators have reached the overbought side of their range. This condition needs to be relieved, but this could happen without a price decline -- as you can see in May and July of last year the indicators dropped toward zero while prices continued higher. Could this happen again this time? Let's look at a longer time frame.
The chart below shows our intermediate-term indicators -- the PMO (Price Momentum Oscillator), as well as the ITBM (IT Breadth Momentum) and ITVM (IT Volume Momentum) Oscillators. They are all in the neutral zone, and have a long way to go before they reach overbought levels, so there is plenty of room internally for prices to move higher. By the same token, there is also plenty of room for them to move lower, but they are not currently acting as if they want to go in that direction.
Finally, let's look at the price index. We can see that it has been hugging the top of the rising trend channel for nearly four months, and it has just squeaked above the line of resistance. This is not a decisive breakout, but it is another manifestation of the persistent bullishness that prices have been displaying for quite a while.
Bottom Line: Our mechanical timing model has been bullish since November 4, 2005. Short-term indicators are overbought and problematic, but medium-term indicators, as well as sentiment, allow for a continued advance in prices for at least a few more weeks.
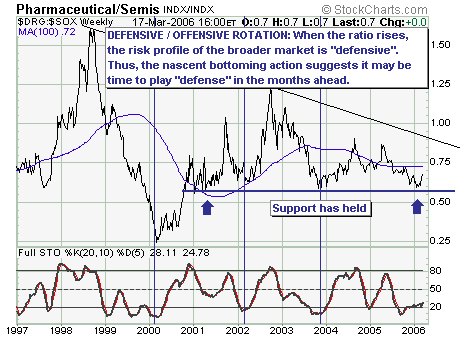
With the broad market indices such as the Dow Industrials and S&P 500 hitting new multi-year highs, one would reasonably believe that the advance has further to travel and riskier and riskier positions taken. However, when we look underneath the hood, we find rotation taking place towards more traditional ?defensive positions?. This suggests market participants are skittish about the lagged effects of the past 2-year Fed interest rate hiking campaign, and are moving to decrease their beta exposure.
Our case in point relates to the ratio between the Pharmaceutical Index ($DRG) and the Semiconductor Index ($SOX). We find multi-year support has held, and our momentum oscillators are trending higher ? thereby suggesting movement towards higher levels in the months ahead. Therefore, we extrapolate this onto the broader market and hence look for prices to weaken towards a more traditional ?mid-term election year? October/November bottom.