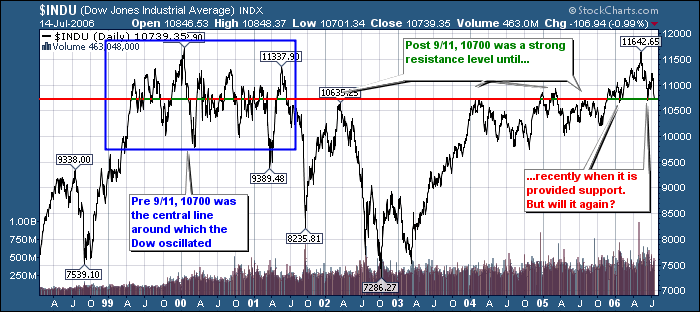
Three big down days have sent the Dow back down to the 10,700 support level. What's that you say? 10,700 is just a number? Just a number like any other? Oh really? Check out this chart:

10,700 is a number that should make your ears perk up. If the current Mid-East problems push the Dow well below 10,700, it will mark a significant change in the market's technical picture.
- Chip Anderson
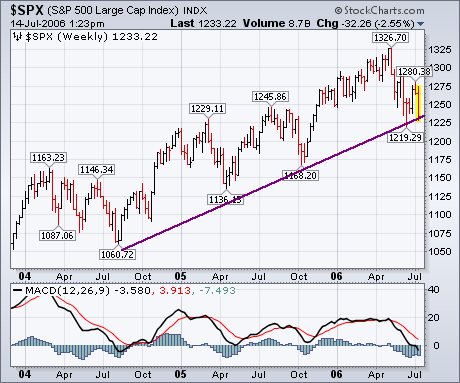
Earlier in the week I showed a number of moving averages that appeared to be on the verge of giving major sell signals. Here's another long-term support line to watch. The S&P 500 is bearing down on a two-year support line that starts in the summer of 2004. A break of that important support line would signal a drop to last October's low at 1168. That would be the first double digit percentage loss since the bull market started more than three years ago. I think the odds are pretty good that it's going to happen. The weekly MACD lines have been bearish for the last two months. This week's downturn has widened the spread between the two MACD lines which means that downside momentum is intensifying. The monthly chart is also in a very dangerous position.

- John Murphy
Subscribe to John Murphy's Market Message today!
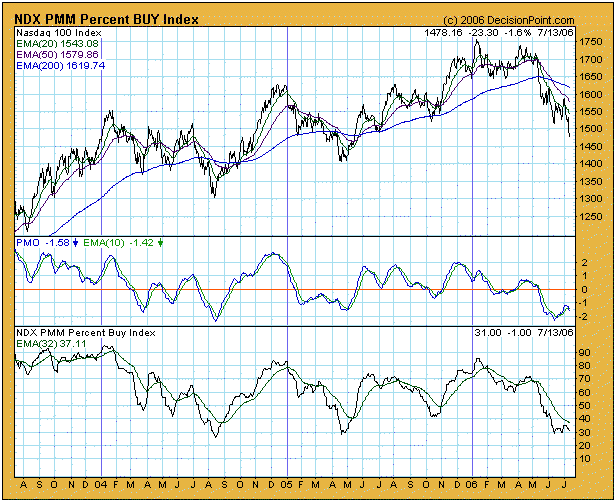
While both the S&P 500 and Nasdaq 100 are showing the effects of the current correction, there are significant differences in the technical picture on both charts. With the S&P 500 we might ask, "Where's the bear?" The 50-EMA of price is still above the 200-EMA, and most important, price still remains within the nearly three-year rising trend channel. The most negative thing about price action is that this correction is currently making a second retest of the rising trend line, something that didn't happen on the three previous bull market corrections. Unless things change for the worse, I'd have to say that the S&P 500 remains in a bull market.
Things look a lot worse for the Nasdaq 100 Index. The 50-EMA is below the 200-EMA, and the price index has dropped down through the bottom of the rising trend channel that has defined the last few years of the bull market. I have no hesitation saying that this index has entered a bear market. This is not good because it tends to lead the broader market.


One thing that may be considered positive on both charts is that the Percent Buy Index (circled) is oversold, but, as you can see, oversold conditions do not always result in price rallies. While the Nasdaq 100 has been oversold for over a month, prices have continued to deteriorate. During that same period, the S&P 500 has held its own, but, again, the oversold condition has only brought a failed rally and second retest of support.
Bottom Line: Our market posture is neutral for both indexes based upon the status of our primary timing model. I think that's a good thing because the market could be transitioning to a bear phase. If this is the case, oversold conditions are dangerous. They can result in furious short-covering rallies that are subsequently prone to failure.
- Carl Swenlin
Visit Carl's website ?
DecisionPoint.com ? for the most comprehensive collection of market indicator charts on the Web. Breadth charts, Investor sentiment charts, P/E charts, even historical charts going back to the 1920s - DecisionPoint has it all!
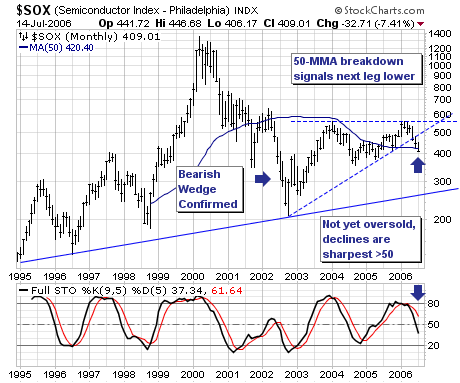
We believe that the Semiconductor Index (SOX) is poised to move sharply lower in the months ahead into a tradable bottom. Our target is rising trendline support near 280, which presupposes a decline of -31% between now and then. Our reasoning is rather simple: First, the fundamental backdrop has been, and will continue to deteriorate in the months ahead as the Fed's previous interest rate increases come to bear. This suggests the news flow will not be positive for semiconductor stocks i.e. Advanced Micro Devices (AMD) warned on revenues and earnings recently. Secondly, the technical picture is deteriorating quickly; a larger bearish wedge was confirmed with the breakdown below trendline support, with this week's weakness causing the 50-month moving average at 420 to be violated as well. To us, this confirmed a bear market is in place, with the next leg lower towards our 280 target level now underway.
We are currently short Lam Research (LRCX), and will look to put on short positions in both MEMC Materials (WFR) and Cymer (CYMI) in the days ahead.

- Richard Rhodes