Hello Fellow ChartWatchers!
There hasn't been much talk about it in the press but the Dow Industrials has continued its slow rise to new heights. How high? On the follow chart you can see that there are only two labelled peaks that are higher than the Dow's current level:
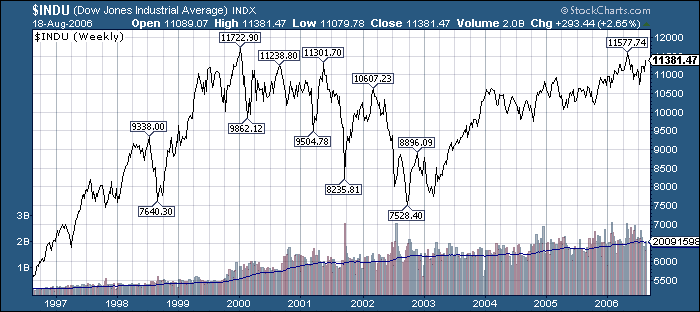
Last May's peak close of 11,577 seemed too good to be true, but if the Dow can re-rally to that level, it will be well positioned for a push up to its all-time high of 11,722 set way back in 1999. Yes, I know, I know. That's just overly optimistic "bubble-talk" right? Well, not exactly. What the Dow is doing is a long ways away from what the Nasdaq did back in 2000:
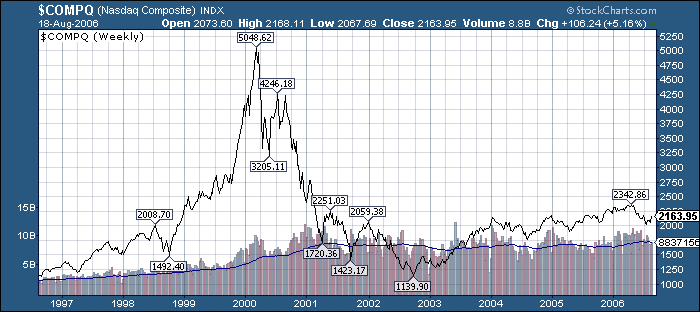
Don't you agree? 
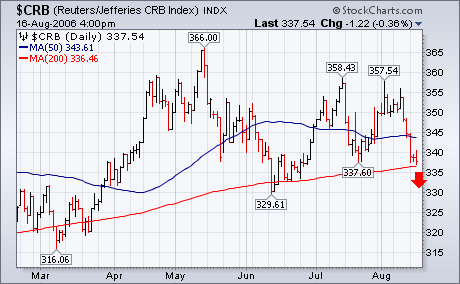
I wrote yesterday about recent selling in commmodity pits pushing the Reuters/Jefferies CRB Index into a test of its 200-day average. Today's five point drop has pushed it below that long-term support line in pretty decisive fashion (see red arrow). Chart 1 shows the CRB peaking in early May at 366 and bottoming in mid June at 329.61. The July rally attempt fell short of its May peak thereby leaving a pattern of "lower tops". Today's price drop puts the CRB in danger of breaking its June low. If it does, it will initiate a pattern of "lower peaks" and "lower troughs" which is symptomatic of a peaking market. That would be the first significant sign of a commodity top in five years. Although most commodities are falling today, the biggest weight on the CRB is coming from the energy sector.
The Russell 2000 has been lagging the S&P 500 and Nasdaq 100 over the last few months. Even with the big bounce off support this past week, the Russell 2000 remains below its August high. In contrast, the S&P 500 and Dow broke above their June highs this week and the Nasdaq broke its early August high this week. With a lower high in early August, the Russell 2000 traced out a bearish descending triangle (blue trendlines) and a break below support would signal a continuation of the current downtrend.
What exactly is a descending triangle? This pattern forms with a series of lower highs (red arrows) and equal lows (green arrows). The lower highs reflect rallies that were weaker and weaker. Buyers were not able to push prices above the prior peak and this shows weakness. The equal lows represent support and this is the place where buyers are still strong. A break below support would mean that sellers overwhelmed buyers and further weakness would then be expected. Based on traditional technical analysis, a break below support at 670 would target a decline to around 610. This downside target is found by subtracting the length of the pattern (60) from the break point.
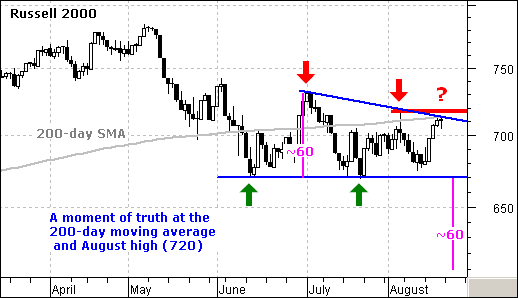
It ain't broken until it's broken. The Russell 2000 remains between a rock (670 support) and a hard place (720 resistance). A break above 720 or below 670 is needed to break the deadlock and establish a directional signal. The 200-day moving average, July trendline and early August high mark resistance here and a breakout would be bullish. Should the index fail and form another lower high, keep an eye on descending triangle support at 670 for a bearish signal.
The Nasdaq 100 Index has declined farther than the broader indexes, and it has been slower in turning around; however, this week the index has turned the corner, and appears ready for a continued advance. The only problem is that it has become short-term overbought.
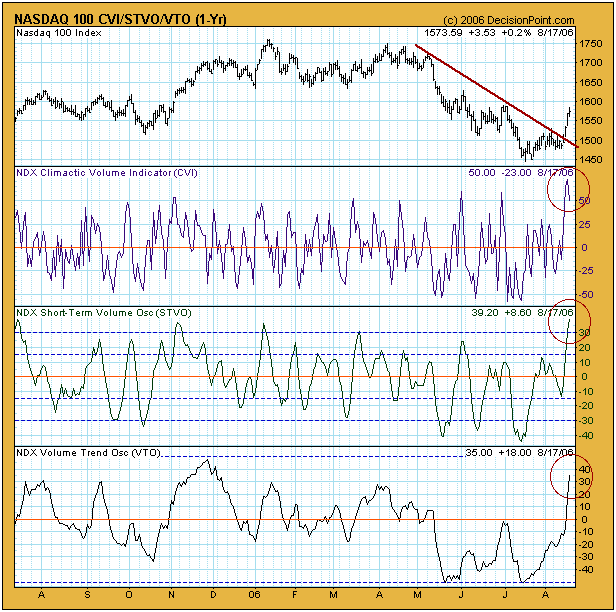
To demonstrate, let's look at the first chart which presents our On-Balance Volume (OBV) Indicator Set. The Climactic Volume Indicator (CVI) measures extreme OBV movement within the context of a short-term OBV envelope for each stock in the index. The Short-Term Volume Oscillator (STVO) is a 5-day moving average of the CVI. The Volume Trend Oscillator (VTO) summarizes rising and falling OBV trends. These charts tell us if the index is overbought or oversold based upon volume in three different time frames.
The first obvious feature is the price breakout above the three-month declining tops line, which signals that the trend is turning upward. Next we can see that the CVI and STVO have both hit their highest level in a year. While this is evidence of the short-term overbought condition, it also implies that an initiation climax has occurred, an event that signals the beginning of a rally.
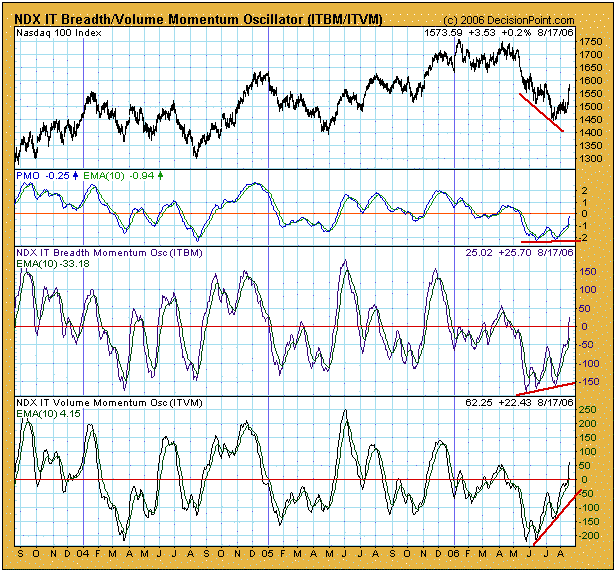
While the short-term overbought condition tells us to expect some pull back and/or consolidation, the second chart presents a positive intermediate-term picture. It displays our three primary intermediate-term indicators for price, breadth, and volume. As you can see, while the price index was making a series of new lows, the three indicators were either flat or trending upward, forming positive divergences. Also, you will note that all three indicators have been moving up from very oversold levels, and they have a long way to go before they become overbought.
Finally, most sentiment indicators we follow continue to reflect strong pessimism, which is bullish for the market.
Bottom Line: Currently, the indicators show us that the trend is turning up. Short-term conditions call for a "pause to refresh," but, once a short correction/consolidation is complete, intermediate-term conditions allow for the rally to continue for at least a few more weeks. Technical analysis is a windsock, not a crystal ball. Be prepared to adjust your tactics if conditions change.
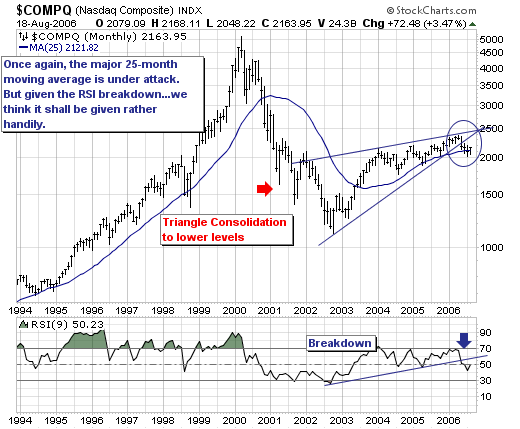
Our recent comments stating we believe a bear market in technology stocks via the NASDAQ 100 has begun remains valid; however, our technical bearish must be tempered somewhat by last week's sharp rally. Quite simply, the rally has put monthly prices back above the 25-month moving average - the level that demarcates "bull and bear markets". If it holds and extends higher, then we must reconsider our stance going forward; but given the rally has come into major daily resistance levels...we are betting that prices will weaken from near current levels in the weeks ahead. In any case, the NASDAQ 100 is "sittin' the fence", and one must pay heed as to which side becomes the "jump off point". Therefore, given we expect a bearish resolution to this technical condition - we are looking towards putting on short positions in several technology stocks that have had stellar gains these past few weeks...over +25% higher. Our top candidates (no pun intended) are Research-in-Motion (RIMM) and SanDisk (SNDK).
