Hello Fellow ChartWatchers!
Did you know that this is the most important time of the year for ChartWatchers that are looking to invest for the mid- to long-term? It is. Mention the month October to many investors and you will see them grow pale. "What about the 554 point drop in the Dow back in 1997?" they will ask. "What about the crash of 1987? And the one in 1929?" However, according to the Stock Trader's Almanac, October, the month that is universally loved by Bears and loathed by Bulls, has been the best performing month for the last eight years in a row! And, over the past 15 years, October has had the best total percentage gain (33.5%) for the S&P 500 of any month.
While impressive, those stats aren't the only reason that ChartWatchers should be observant right now. October is also the transition month from the worst performing six months of the year to the best performing six months. Many long-term systems used to say "Buy on November 1st and sell on April 30th" - now they say "Get a jump on things by looking for a good entry point in October." Just another example of the market always adjusting to try and "improve" on any well known timing system.
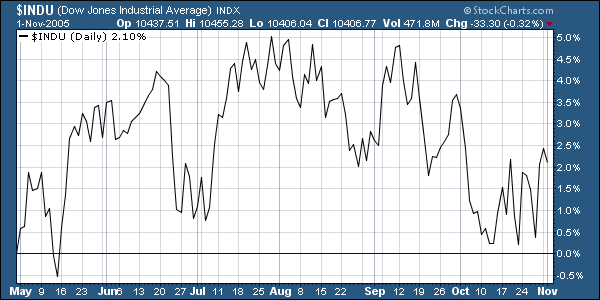
Let's see how this simple 6-month timing strategy played out last year. Here's the performance of the Dow during the "Summer Doldrums":
And here's what happened in the six months after that period:

Wow! That's a nice little difference there. Click on the charts to see how they were setup - then go in and change the year settings to see what happened in other years. In general, you'll find that the Winter chart outperforms the Summer chart quite nicely. Which brings us to the current situation:
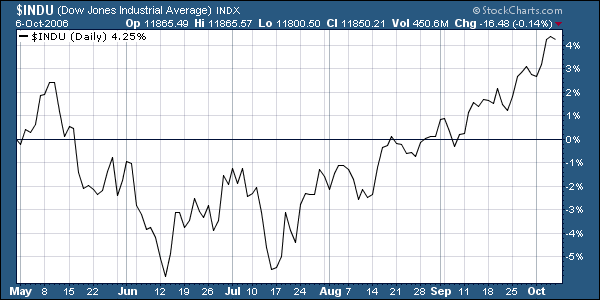
Hmmm.... so far the "Summer" months are up 4.25% and the Dow is setting new all-time highs again. Will the Winter months outperform the Summer months again this year? To do so, the Dow would have to rise more than 4.5% above it's current all-time high(!). Despite that concern, people that trust in this historically effective system are watching closely for an entry point between now and November 1st.
Note: I'm getting the data about monthly market performance from the latest version of the Stock Trader's Almanac 2007 which has just arrived from the printers. John Murphy and I agree that this is one of the BEST timing guides out there and should have a cherished place on everyone's desk. Want to know if the January effect is real? Want to know the odds that the Dow will rise on any given day? Want to know the best time of the day to place a trade? THIS ALMANAC CAN TELL YOU!
Because we really want all ChartWatchers to have this amazing market tool, I've told our bookstore folks to heavily discount it for the next two weeks. Right now, the Stock Trader's Almanac 2007 is available in our bookstore for only $24.45US - that's over $10.00 less than its regular price! Please, take a moment and order your copy right now. Outside of a subscription to StockCharts.com, I don't know of a better way of improving your investing results.
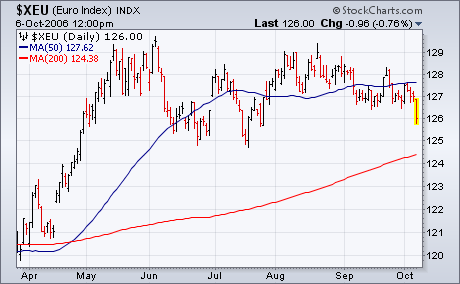
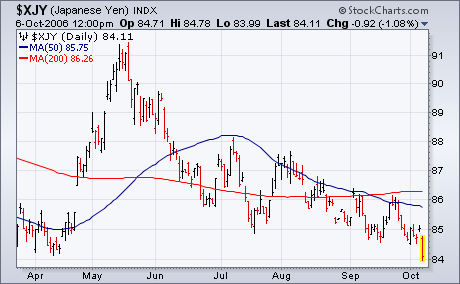
The dollar is having one of its strongest days in months. Part of the reason is the drop in the U.S. September unemployment rate and some upward revisions in recent job creation. The report diminished hopes for rate reductions by the Fed in the near future. In addition, Japanese reports of a possible North Korean nuclear test over the weekend also weakened the yen and caused some flight to dollar safety. The bottom line is that the Euro is falling to the lowest level in three months (Chart 1), while the yen touched a new six-month low (Chart 2). Having said that, I'd like to revisit a couple of other bullish factors for the dollar that I wrote about a couple of weeks ago. One has to do with the recent drop in commodity prices and the other which is recent underperformance by foreign stocks. Both trends are consistent with a firmer U.S. dollar.
After lagging QQQQ and SPY throughout September, the Russell 2000 iShares (IWM) got into the action last week with a surge from 71 to 74 (4.2%) on Wednesday and Thursday. The ETF remains well below its May high and is still lagging over the last few months, but this October surge is a good sign for small-caps.
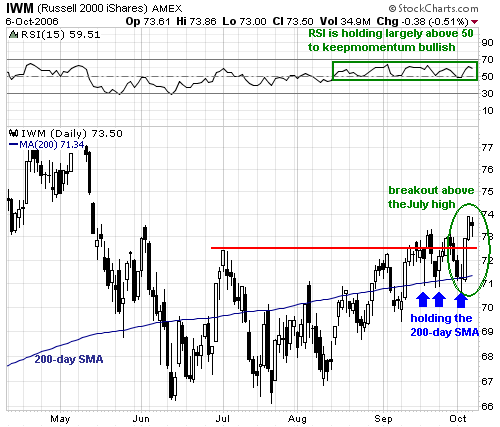
On the price chart, IWM broke back above the 200-day moving average in early September and held this moving average three times in the last three weeks (blue arrows). The ability to find support around 71 was followed by a break above the July high and IWM is starting to look like its old self again. Indicator-wise, RSI held support around 50 and has been trading largely above 50 since mid August to keep momentum bullish.
The bulls are in good shape as long as RSI holds above 50 and IWM holds above the last three reaction lows (blue arrows). A strong stock should hold its breakout and we should accept nothing less. The upside target would be to the May highs. Failure to hold this recent breakout and a move below last week's low at 70.68 would be bearish for IWM. For RSI, a move below the October low at 47.5 would turn momentum bearish.
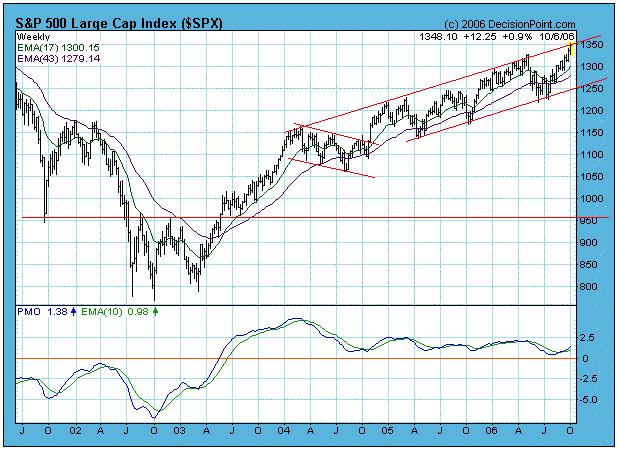
The structure that has dominated the price pattern for nearly three years is a rising trend channel, which I have drawn on the S&P 500 chart below. As you can see, the price index has once more encountered the top of that channel, and that resistance will probably prevent any significant price advance until overbought conditions have been allowed to correct.
That is not to say that a major price reversal is imminent. It is certainly possible, but it is also possible that prices will dribble along the bottom of the overhead trend line for several months as happened prior to the summer price lows.
There are two things that argue for a major price decline. First, is the seasonal weakness that the market traditionally experiences in October, and the other is the 4-Year Cycle lows, also expected in October.
On the other hand, investor sentiment continues to remain at strongly bearish levels. Note on the Rydex Cash Flow Ratio chart below that the bears have scarcely budged from the bearish side of the three-year range, in spite of the fact that prices have moved steadily higher.
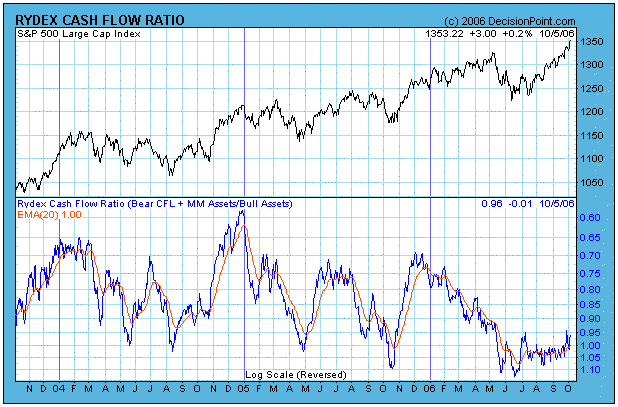
Bottom Line: It seems reasonable to expect some weakness over the next several weeks, but I will remain bullish until our mechanical model says otherwise. Even though cyclical and seasonal pressures present problems, I think that sentiment is the trump card. It is hard for me to imagine a major decline beginning when there are so many bears out there.
Technical analysis is a windsock, not a crystal ball. Be prepared to adjust your tactics if conditions change.
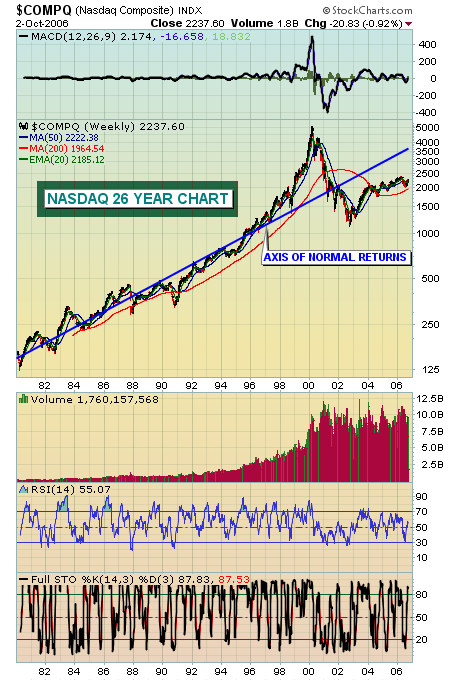
After a decent run up in stock prices, one of the questions always heard is "is it too late to buy?" Well, there's never a guaranteed right answer and a lot of analysts would say the bull market is long in the teeth and has run its course. I am not in that camp - far from it. The stock market has a history of volatility where it becomes almost euphoric near long-term market tops and utterly depressed at bottoms. Market prices move higher over time because earnings, over time, grow. But we also know that earnings can swing wildly in both directions, especially on the technology-heavy NASDAQ. Earnings multiples can expand quickly in rising markets and compress just as quickly in descending markets. So how can you truly value a market or determine whether a market is overvalued or undervalued? Let's start with the realization that the stock market is inefficient over short periods of time, but very efficient over longer periods of t ime. In the end, the market generally gets it right.
I refer to the chart below as the "axis of normal returns." It's a chart that dates back to 1980 on the NASDAQ and attempts to find the "middle of the road" in terms of market valuation, where approximately half the time the market is overvalued and the other half undervalued. The theory here is that the market goes too far in both directions and it takes time to steer it back on course. It's simple to look back and say the NASDAQ was incredibly overvalued in 2000. That doesn't matter any more though. Those days are over. The current question is, based on history, are we overvalued or undervalued NOW? Based on the chart, I'd say we're undervalued, perhaps significantly so. We've had swings above and below the "axis of normal returns", but we've always gravitated back to the normal line. I see no reason to think any different this time.
Many market pundits would suggest this bull market has run its course. I argue that what we've seen since 2002 is just the beginning of a move that takes us back to that "axis of normal returns." Time will tell who's right.
The sharp technology share rally has caught many "off-sides" to be sure. Take for example the NASDAQ 100 "Q's" +13.4% rise off their June low; this is quite impressive indeed...but not as impressive as the +19.7% gain in the Semiconductor Index (SMH). Our forecast is for the "Q's" to decline in the weeks and months ahead; thus, we are asking ourselves the question as to whether SMH will continue to perform relatively "better"...or "worse". It is a reasonable question, and one we will answer as "worse". In fact, given the past several day SMH trading action - we can now make the risk/reward case that selling short at current levels makes good trading sense.
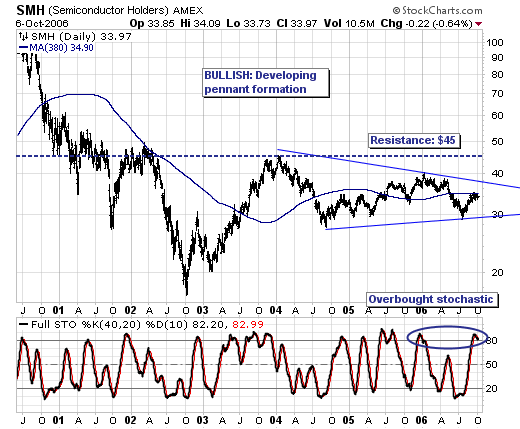
First, let us note that we "respect" that the SMH chart has formed a very large bullish pennant pattern; it is not yet confirmed given trendline resistance has yet to be taken out, but it is certainly a sight to behold and perhaps a trade for another day. Our current focus is upon the 380-day moving average, for it has proven its merit as an "inflection point" for profitable trades. At present, price action has attempted to breakout above this level, but this overhead resistance level continues to prove is merit. This, coupled with the overbought 40-day stochastic suggests that there is further downside remaining back to the previous lows at $29.
Therefore, from a trading perspective - putting on a short position at SMH's current level of $34.29, while using a "close only" stop loss at $35.80 makes immiently good trading sense. We are risking $1.50 to return between $5 and $7; our initial trade target is between $27-$29.