Here's what a strong techincal picture looks like:
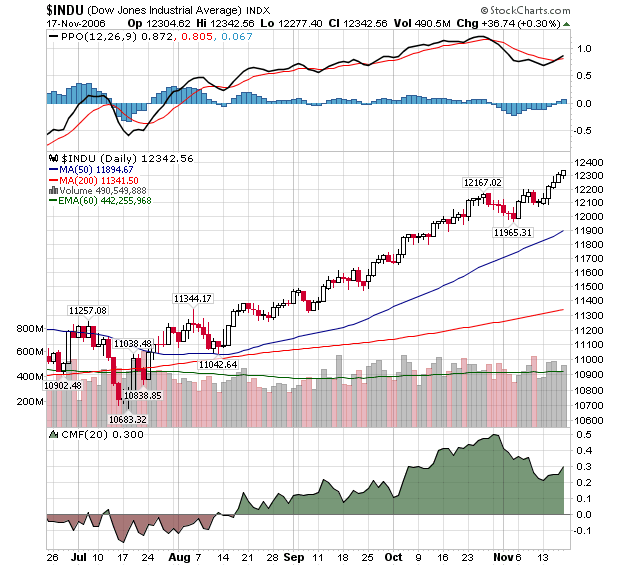
Record closes for each of the past 4 days. Steady volume. Increasing Money Flow values. Quick recovery from a recent downturn. Bullish MACD cross-over. This chart has it all!
Unless...
Maybe too many good signs is a bad sign. Maybe this baby is too "overbought" and is due for a correction. Things cannot possible get any better, right?
This is the classic problem that investors face during a bull market. Reversed, this is the same dilemma that they face in a bear market too. However, this is really NOT a problem for disciplined technical analysts. The charts are good and therefore you buy (or hold). Period. End of discussion. End of doubt.
Now sure, you watch carefully for changes in the charts and you move your stop loss levels accordingly. But until the chart changes - until your trendline is broken or your indicator turns down, you just enjoy the ride. Done correctly, Technical Analysis should remove fear and doubt from your investing, not add to it.
FALLING COMMODITIES HURT CANADA ... When commodity prices started to slide several months ago, I suggested that certain global stocks markets might suffer from falling raw material prices. One of them was Canada. Chart 1 shows the Toronto 300 Index (TSE) in the process of challenging its spring high. That's not too bad unless we consider that most other global markets have moved well beyond that chart barrier. The more important line on the chart is ratio of the TSE to the Dow Jones World Stock Index (solid line). Notice that the line has been falling since May. The means that the Canadian stock market has gone from a global leader to a global laggard during 2006. The line below the chart is the CRB Index which peaked in May. You can see a close correlation between the falling CRB Index and the falling relative strength line for Canada. Canada benefited from the bull market in commodities for several years. It's now being restrained by falling commodity prices.

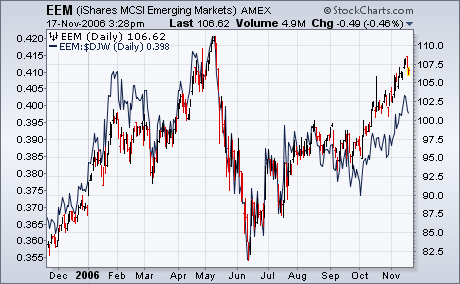
EMERGING MARKETS ARE ALSO LAGGING ... I also suggested over the summer that emerging markets might suffer from falling commodity markets. I suspect there are other forces at work including a move away from riskier assets to more established large-cap stocks in developed stock markets. Even so, emerging markets as a group have become global laggards over the last six months. Chart 2 shows the Emerging Markets Ishares (EEM) still trading below their spring peak. The solid line is a ratio of the EEM to the Dow Jones World Stock Index, and it shows global underperformance by emerging markets since May. I suspect falling commodity prices have something to do with that since many emerging markets are producers of raw materials. Global leadership appears to have shifted to Europe and Asia (ex-Japan).
For the third time in three months, QQQQ broke consolidation resistance and the uptrend shows no signs of abating. The gray ovals show consolidations in the second halves of August, September and October. These were followed by breakouts in early September, early October and early November. Broken resistance turned into support at 39.5 in September and again at 41 in October. These breakouts held and QQQQ never looked back. That shows strength.
On the most recent breakout, broken resistance at 43 turns into support and this is the first level to watch for signs of trouble. A strong ETF should hold its breakout and this is exactly what QQQQ did in September and October. A move below 43 would be negative and call for a re-evaluation.
Even though a move below 43 would be negative, I would not turn bearish right away. There is a big support zone around 41.5-43 from the October consolidation. In addition, RSI held above 50 since mid August and this level marks key support for momentum. QQQQ would have to break below the October lows (41.5) and RSI would have to break below 50 to reverse the medium-term uptrend. As long as both hold, the trend is firmly bullish and further gains should be expected. In Dow Theory talk, the trend is in place until proven otherwise and I have yet to see any evidence to the contrary.

For quite a while I have been saying that the rally that began in July has been driven by persistent bearishness among investors. I still think this was a significant element, and it was encouraged by a strong belief that a major decline would be occurring in October in conjunction with the long-awaited 4-Year Cycle trough. Unfortunately for the bears, it appears that the 4-Year Cycle trough arrived early and without much fanfare (because the price decline into the cycle low was not very impressive).
On our first chart we can see that the Cycle trough occurred after a mere 7.5% decline and appeared in the form of a double bottom in June and July.
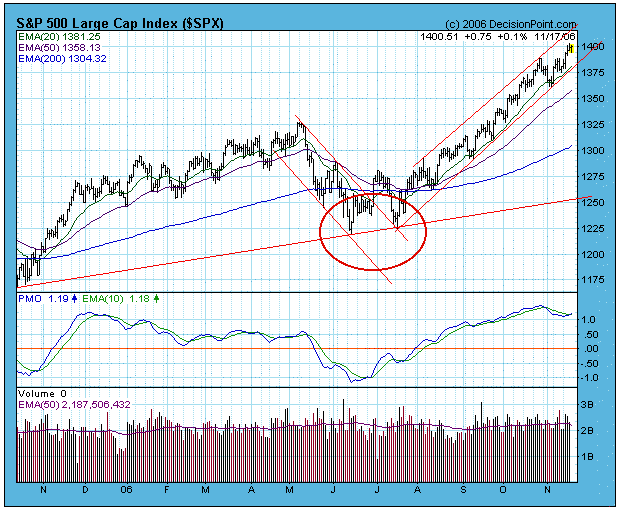
While the Cycle low was easy enough to spot on a one-year daily chart, it shows up only as a small blip on the long-term monthly semi-log chart below. While it clearly fits into the nominal 4-year periodicity, the decline was not nearly as dramatic as many others in the past, and it is easy to see why many investors were fooled into waiting for a deeper decline in the traditional October time frame.
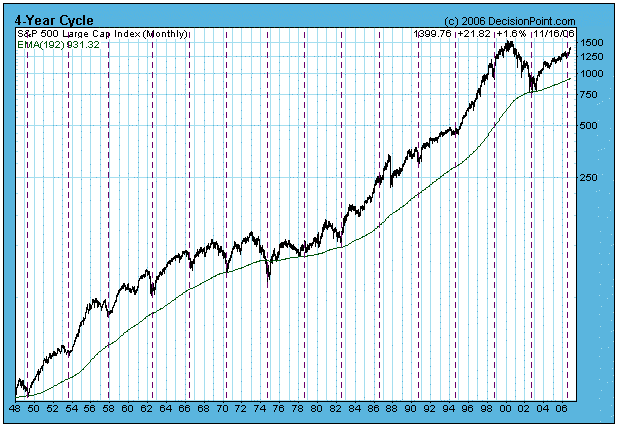
Assuming that my cycle assessment is correct (some will say that it isn't), and assuming that the new 4-Year Cycle unfolds in a "textbook" fashion (it very well may not), it is most likely that we have begun another up leg in the bull market that will last for a few years. While that is a distinct possibility, I personally will not count on it too heavily, because we can clearly see on the chart above that some cycles are far from typical.
The cycle model can help explain current market action, and it can help us anticipate future price moves; however, rather than try to predict the future, I still find it best to let our trend-following tools/models point the way and drive our decision-making. The table below shows the status of those models as of Thursday.
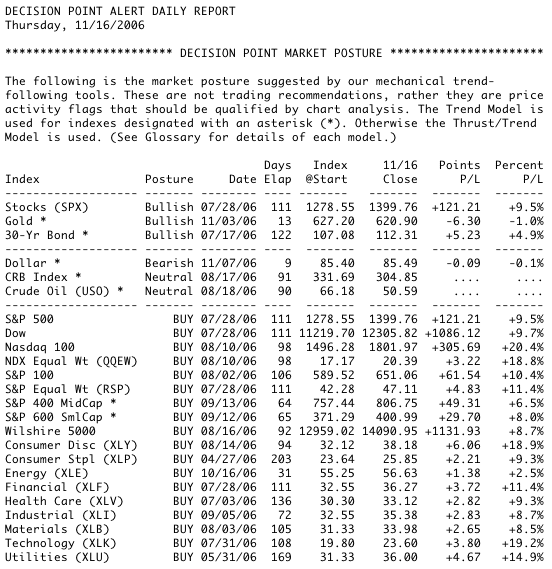
This table is updated for subscribers every trading day in the Decision Point Alert Daily Report.
Bottom Line: Many investors are still expecting a major decline later this year, but I think that is unlikely because a new 4-Year Cycle is beginning. Prices should remain in an up trend for several months, if the cycle unfolds in a typical fashion.
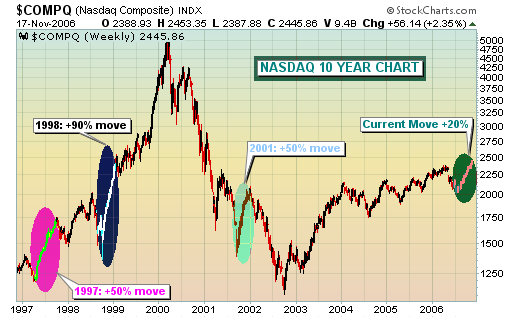
Not very likely. We've seen a very strong earnings season. Economic report after economic report suggests the Fed is done with its interest rate hike campaign. There are too many non-believers in the market's advance, just take a look at the short-sellers. Lots of cash sits on the sidelines - on corporate balance sheets and in money markets. Applied Materials reported earnings this week and indicated they had reduced the outstanding number of shares in their float by 10% due to an aggressive share buyback plan. We are seeing increasing interest among private investors in taking public companies private. These are clear signs that equity valuations are cheap. As interest rates decrease, and we've witnessed this over the past few months on the ten year treasury bond yield, earnings become more valuable and multiples naturally expand. But this rally has added fuel. It's the supply and demand relationship. Applied M aterials is just one example of many companies who are aggressively buying back their own shares, thus reducing supply. Notice the attention recent IPO's have received. There is a thirst for equities. Short-sellers have all but guaranted there will be demand to fuel this rally. A few weeks back, I posted an article describing the "axis of normal returns", then showing visually where the NASDAQ might be headed in the next couple years. I was hugely bullish then and I remain so now. Yes, the NASDAQ has advanced over 20% off its recent bottom, but history suggests there could be much more to this current rally. Look at the chart below. I deliberately ignored the 1999-2000 melt up and focused on other time periods where we've seen an uptrending NASDAQ. Notice many of the other "straight up" moves have jumped by considerable percentages. The NASDAQ's current move pales in comparison.
