2006 REVIEW, 2007 PREVIEWby Chip Anderson | ChartWatchers
Happy New Year's ChartWatchers!
Hopefully the start of 2007 finds you more prosperous than you were at the start of 2006. That's always the goal and, given the performance of the major averages during 2006, it looks like many people achieved it.
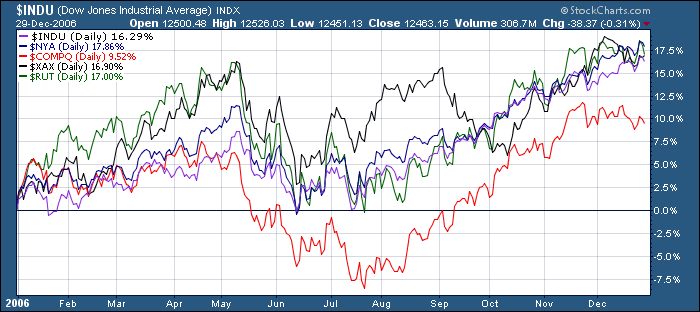
Basically, everything was up about 17% for the year except the Nasdaq which had a flat start and then was overly punished during a big drop in mid-May. The Amex had the most "interesting" journey through the year as its oil-heavy nature caused it to outperform everything else during the middle of the year.
So, what's up for the start of 2007? Well, the current technical word for the markets is "overbought". A strong, long rally has pushed most technical indicators into overbought readings. This chart of the Dow shows the situation clearly:
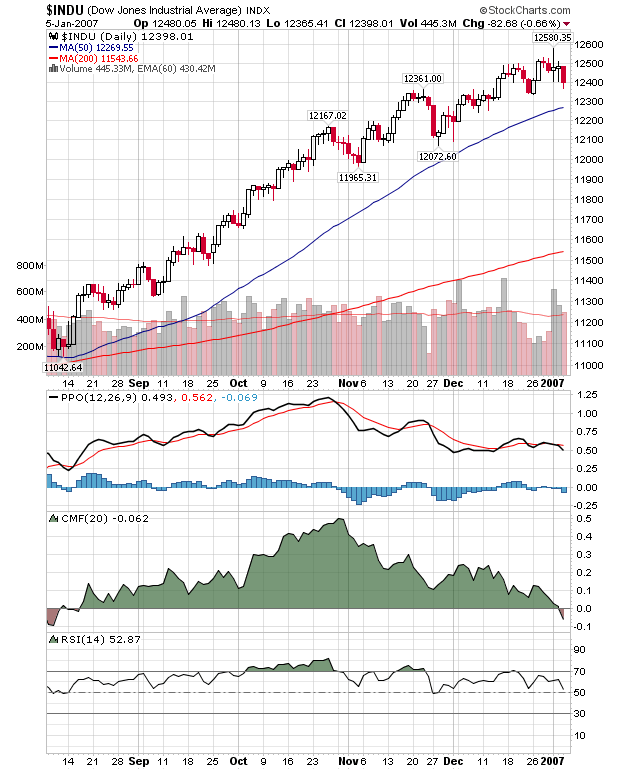
As I have said on many occasions, the Chaiken Money Flow (CMF) is one of my favorite "quick" indicators because it combines price action with volume action and gives very clear signals. The fact that the CMF recently went from positive to negative territory should not be ignored. With the MACD and the RSI both moving lower as well, caution is indicated.
WHAT TO EXPECT FROM STOCKCHARTS IN 2007
2006 was another great year for StockCharts.com. We set records for revenue, subscribership, charts served, ticker symbols followed, and just about every other category you can think of. Key accomplishments include the successful launch of SharpCharts2 back in May, our first charting contest, improved Google-based site searches, a new wiki-based ChartSchool, a 40% increase in our bandwidth capacity and the installation of a completely redesigned server facility.
2006 also saw us reinvest more money into our technical infrastructure than ever before. We continue to improve our ability to serve high-quality charts quickly and consistantly to all corners of the globe.
So, what's up for 2007? In two words: Scans and Favorites. While we will continue to improve all areas of the site, our key developers hope to focus on making significant improvements to our Scan Engine and to our Favorites management tools this year. Stay tuned for more details on our progress in the coming months!
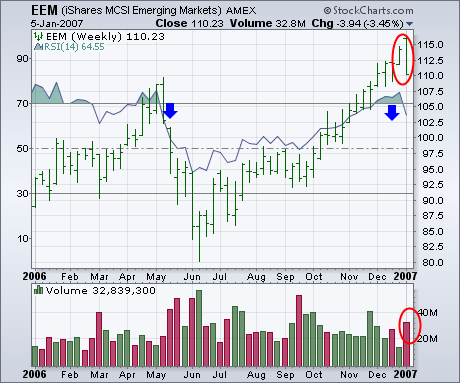
The MSCI Emerging Markets iShares (EEM) suffered a downside weekly reversal on heavy volume as shown in the chart below. In fact, the EEM had its biggest weekly fall in more than three months. At the very least, that suggests that a pullback of some type is probably in store. That cautious view is supported by the 14-week RSI line (blue line) which had been trading in overbought territory over 70 for the first time since last May. The RSI line has fallen below 70 for the first time since the last EEM peak eight months ago. Since emerging markets had been leading the global rally during the second half of 2006, any serious pullback in that group would most likely weaken most other global stock markets ? including the US.
HHH STARTS 2007 WITH A BANGby Arthur Hill | Art's Charts
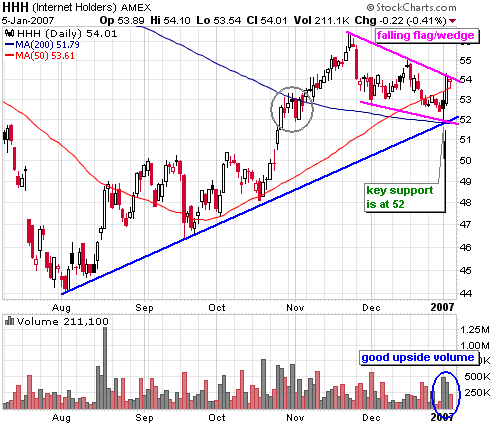
The Internet HOLDRS (HHH) started 2007 with strong move on good volume, but the ETF was knocked back on Friday and remains just short of breakout. Follow through is the key.
The Internet HOLDRS (HHH) formed a falling flag/wedge over the last six weeks. These are typical for mild corrections, but the correction is not over until there is a breakout. This week's surge carried HHH to the upper trendline and follow through above the December high at 55 would be most bullish. I would also like to see expanding volume for confirmation. Also note that Google (GOOG), Yahoo! (YHOO) and Ebay (EBAY) have similar patterns working and Yahoo! is taking the lead.
The January surge reinforces support at 52. There are a number of reasons for support at 52. First, HHH broke above the 200-day moving average in early November and this moving average now becomes support around 52. Second, the August trendline extends up to around 52 in early January and has been touched at least three times. Third, there is a small consolidation in late October and early November that argues for some support around 52 (gray oval). Failure to hold the early January gains and a move below the January low at 51.93 would be bearish for HHH.
The purpose of this article is to introduce a new set of market indicators that DecisionPoint.com has recently released, indicators constructed from only common stocks listed on the NYSE.
A little background, at its inception The NYSE Composite Index was composed of all the issues listed on the New York Stock Exchange. The approximately 3,500 components were cap-weighted by total shares outstanding, and the NYSE Composite was one of the dullest indexes in existence. In January 2003 this all changed in a major way. The composition of the index was changed to include only common stocks listed on the NYSE (approximately 2,050), and they are cap-weighted based on the float (the shares available for trading). The result has been that the new NYSE Composite is now one of the top performing broad market indexes. For example, during the rally that launched off the July 2005 lows, the NYSE Composite had gains second only to the Nasdaq 100 Index.
When the NYSE Composite was reconstituted in January 2003, the NYSE failed to publish statistical breadth and volume data related to only the 2,050 components on the index. Rather, the NYSE and all media sources continued to publish data based all the 3,500 issues listed on the exchange, and most technicians (me included) continued to use these flawed data to construct indicators for the NYSE Composite. It was, after all, the only data available, but the resulting indicators had to be taken with a grain of salt. Let me explain why.
The NYSE Composite components are only common stocks, whereas the approximately 1,500 issues excluded from the Index are mostly not common stocks and are primarily issues sensitive to interest rates. By using data from all NYSE issues listed, indicator results are being contaminated by 1,500 issues that are totally unrelated to the Composite Index, and that often behave as a group in a manner completely different from the 2,050 index components. As a consequence, market indicators generated from this questionable data must necessarily be considered somewhat unreliable.
In late-2005 we decided to fix this problem. Since we track the list of NYSE Composite component stocks, we began collecting these Common Stock Only (CSO) data, and we developed a standard set of indicators based upon it. We also back-calculated the raw data and indicators back to January 2003. We have just released the new set of 10 indicators to our subscribers. If I may be allowed for a moment to be humility-challenged, the release of these indicators is a very big deal for many technical analysts. The scarcity of the raw data means that few services can offer these indicators, and some of these indicators are only available from DecisionPoint.com.
Is there any real difference between the Common Stock Only (CSO) indicators and those based upon All NYSE Issues? Yes, there are many differences, ranging from subtle to significant. Let's look at New High New Low charts as an example. Obviously, the CSO highs and lows have a smaller range because there are fewer stocks involved, but one difference that really stands out is the huge down spike of All Issues New Lows in May 2004, whereas, the CSO version shows merely a slight down blip.
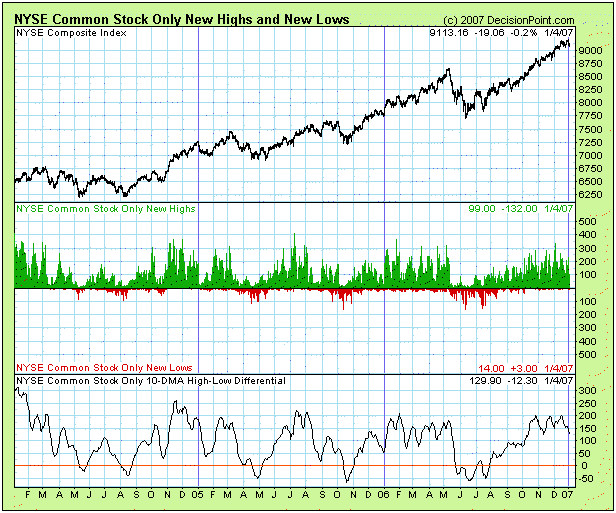
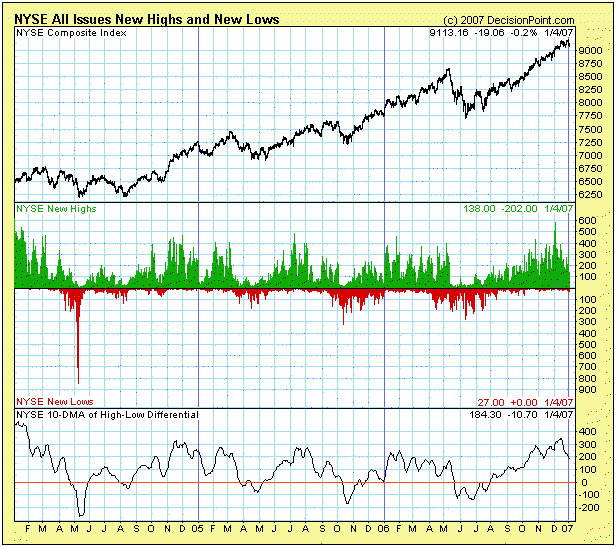
Bottom Line: Whenever possible, market indicators should be constructed from data derived from the component stocks of the index to which the indicator is applied. In other words, the S&P 500 Advance-Decline Line should be constructed from the action of S&P 500 stocks. For too long NYSE Composite indicators have been corrupted by data from stocks that are not part of the NYSE Composite Index. It is with great pleasure that DecisionPoint.com has released a set of NYSE Composite indicators that are based on real NYSE Composite Index data.
AIRLINES FLYING HIGHby Tom Bowley | InvestEd Central
Don't look now, but the airlines have found their wings. After drifting lower for the better part of 7-8 years, something strange has happened. Could it be? Yes, airlines are breaking out! I know it sounds impossible, but airlines for the first time in nearly a decade have become an attractive investment. Take a look at Chart 1 and you'll see that the multiple tops just above 56 were taken out in mid-November. Since that time, we've seen a nice retest of the breakout level and a reset of the momentum oscillators. The MACD came all the way back down to touch its zero line, or centerline. RSI and Stochastics, both overbought after the breakout, reset into neutral territory during the retracement period.

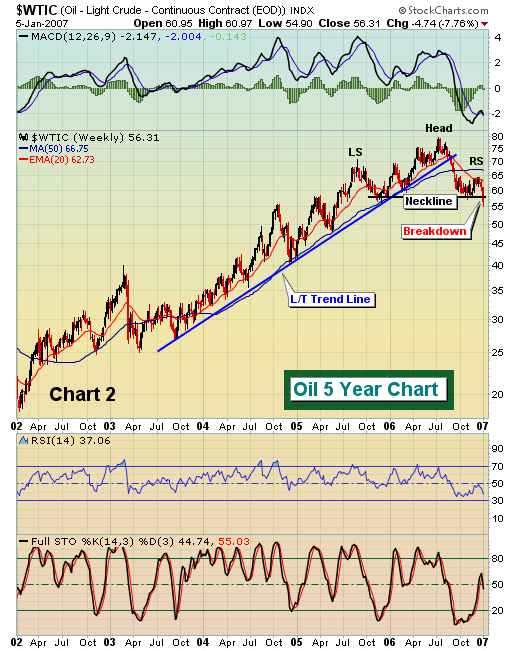
The sector has worked through mountainous debt and excess capacity and now actually appears to be in a position to raise prices in 2007. Combine that with potentially lower oil prices in 2007 and you can see why smart money seems to be rotating into the group. In Chart 2, check out the breakdown in crude oil. First, we saw the long-term trendline break late in the third quarter, coincidentally just before airlines broke out. Second, we've seen a head and shoulder top form on the crude oil chart with the neckline failing to hold support this week as crude oil saw its largest two day drop in more than two years.
For the first time since 1998, airlines may have earned a trip into your portfolio. Happy trading!
KEEPING AN EYE ON ENERGYby Richard Rhodes | The Rhodes Report
With the first week of the year out of the way; we have seen a rather sharp and violent sell-off in a number of asset classes including energy. Our interest is energy stocks: we think the sell-off has gotten a bit "overdone" to be sure as the oil service sector has dropped -7%; but as we know - markets can remain irrational far longer than we can stay solvent fighting them. But a buying opportunity is being created; however, it isn't in the oil service shares where we want to place our trading capital...it is in the integrated oil producers such as Anadarko Petroleum (APC); Conoco-Phillips (COP) Hess Corp (HES); Occidental Petroleum (OXY) and Valero Energy (VLO).
Our reasoning is technically oriented; the integrated oil vs oil service ratio has broken out to the upside through trenldine resistance, and has indeed found support recently at the 200-week moving average. Moreover, the 14-week stochastic has corrected an overbought condition, and nascently turning higher. Given this, we think that previous high resistance of mid-2002 and mid-2005 at 6.4 will be broken, with a move thereafter upwards of the 2001 high at 7.6.
