Hopefully things have been better at your house than they have been here in the Pacific Northwest. So far this winter we've had record rainfall, huge windstorms, long power outages, lots of snow, tsunami warnings, icy roads and record cold. The joke these days is "What else?" - although I really don't want to think about the possible answers to that!
Despite Mother Nature's wrath, the market has continued to climb albeit more slowly than last month. Our intrepid commentators have been watching with keen interest and their reports are below. While John sees reason for near-term optimism with the Nasdaq, Richard, Carl and Arthur all have their attention on the energy sector and Tom Bolin talks about biotechs.
Take care out there! Spring will be here soon...
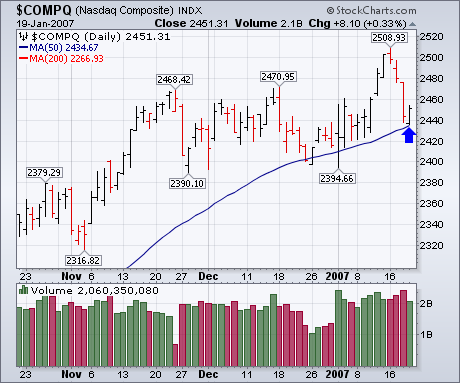
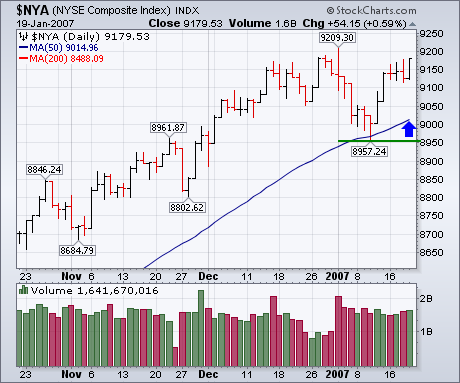
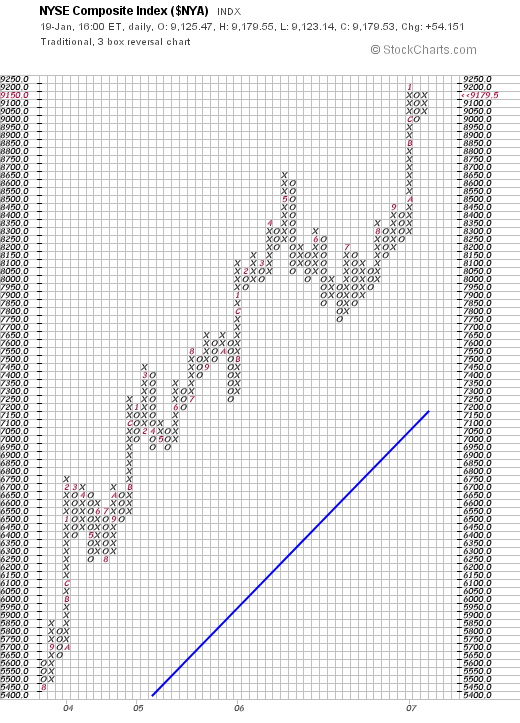
The market closed the week on an upnote. The most important action took place in the Nasdaq market which bounced off its 50-day moving average (Chart 1). Broader market measures have held up much better. Chart 2 shows the NYSE Composite Index ending the week just shy of its old high. It's well above moving average support. It remains to be seen if today's oversold rally in the oil market continues next week and if that causes any short-term profit-taking in the market. Even so, the NYA would have to break its January low to warrant any real concern. Chart 3 ends with a point & figure chart of the NYA. [Each box is worth 50 points]. It shows the continuing uptrend that started at 8050 during June. The NYA needs a close at 9250 or higher to resume its uptrend. It requires a close at 8950 or lower to trigger a sell signal.
The U.S. Oil Fund ETF (USO) remains in a clear downtrend on the daily chart, but became oversold and reached long-term support on the monthly chart. The combination of oversold conditions and support argue for at least a consolidation and quite possibly an oversold bounce back to broken support at 50.

On the daily chart, I am using RSI to identify oversold conditions. RSI moved below 30 (oversold) in early January and stayed oversold until Friday (19-Jan). The indicator is making a move back above 30 and this is the first positive sign in 2007. Before getting too excited, notice that RSI was oversold all of September and moved above 30 in October. However, USO traded flat and there was not much of a bounce until late November. A bounce could take time.
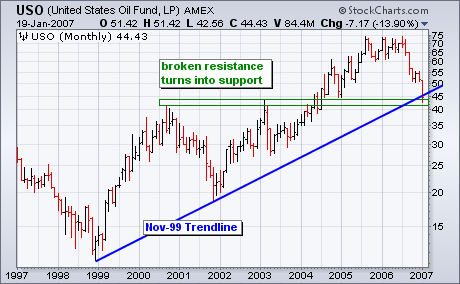
In addition to oversold conditions, I see reason to expect support around 42-45. For the falling price channel, I drew the upper trendline first and the lower trendline is parallel to this trendline. The lower trendline extends to around 42.5 and this trendline acts as support. USO firmed between 42.5 and 45 this week to affirm channel support. The monthly chart also confirms support around 42.5 with the Nov-99 trendline and support from broken resistance.
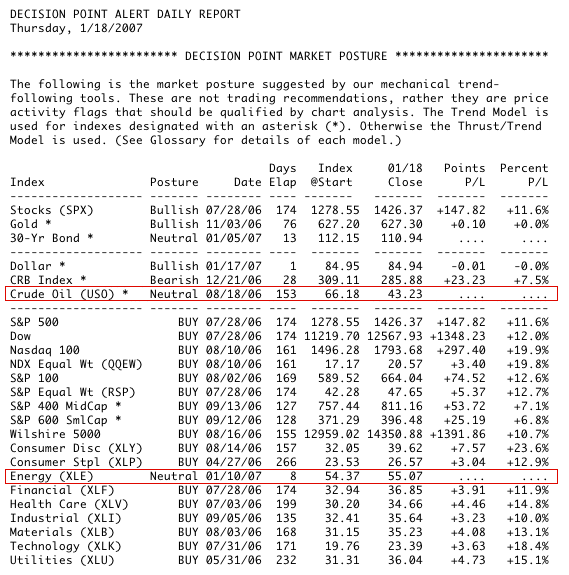
Energy stocks as represented by the Energy Spider (XLE) have been moving in a more or less sideways direction since crude oil topped out in July and entered a bear market. I find it peculiar that energy stocks have consolidated at the same time that crude oil was crashing, but it does give us a clear sign of strength from that sector. Now I am seeing evidence that the correction in energy stocks is nearly over.
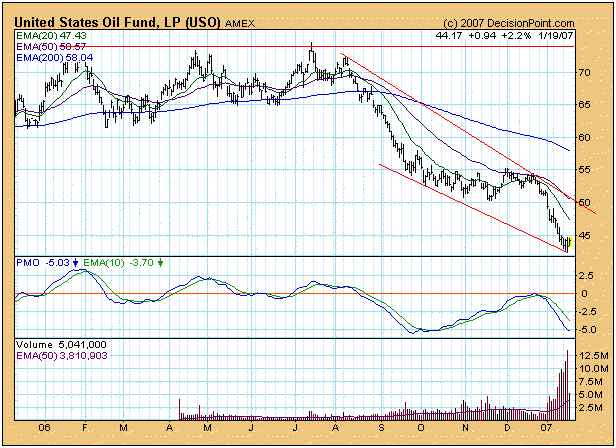
First, on the chart below we can see that crude oil is very oversold and is probably ready for a bounce. I would not care to speculate whether or not the bear market is over, but a 42% decline certainly entitles crude oil to a reaction rally or at least a correction. Either way, this would benefit energy stocks.
On the next chart the evidence is even more compelling. The Percent of PMO Crossover Buy Signals shows that the XLE stocks are very oversold in the short-term, and this condition happens to coincide with a medium-term oversold condition reflected by the Percent Buy Index, an alignment that implies that the expected rally should have staying power.
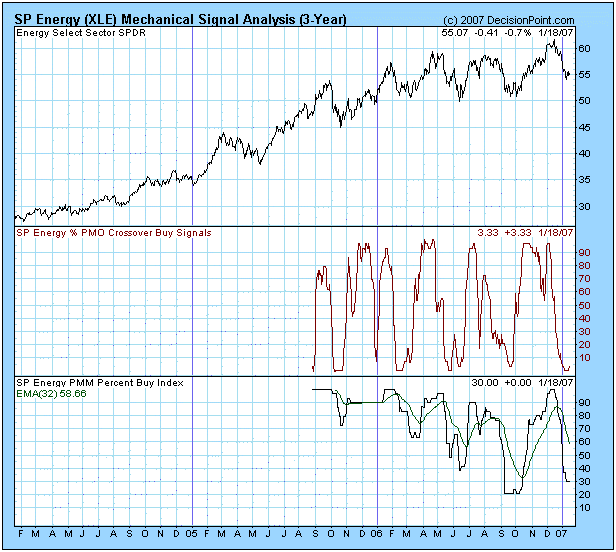
Bottom Line: I am not suggesting that we try to pick a bottom here, but the conditions are favorable for a good rally in energy stocks once prices begin moving upward enough to trigger a buy signal. I should point out that timing model performance on this sector has been marginal because of the sideways chop of the last year or so.
Healthcare stocks have been performing quite nicely over the past few weeks. Looking at the Biotech Index, it appears more bullishness is on the way for this sub-sector. After a nasty 20% selloff from March through May, biotechs stabilized during the summer months before beginning an uptrend that netted over 160 index points in a three month span beginning in August. The continuation pattern that formed over the past two months is the cup and handle pattern. On the chart below, I've highlighted the cup formation. Just to the right of the cup, you'll see the sideways consolidation, or handle. As its name implies, a continuation pattern is one in which the prior trend resumes after a brief consolidation, or basing period, is completed.
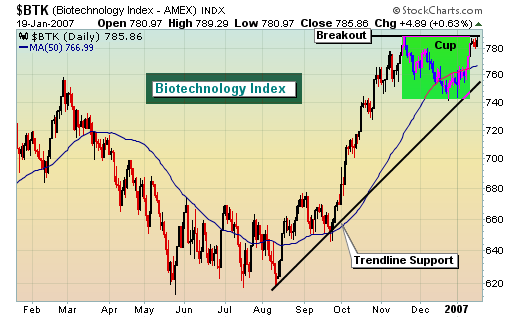
Watch for a breakout above the handle that is forming. Though the biotechs appear poised for yet another move higher, keep in mind this group carries with it a tremendous amount of risk. You should consult your financial advisor before considering a position in this volatile sector.
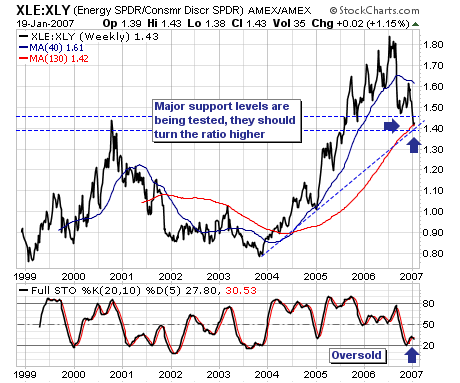
Today we want to look at a "pairs trade" theme we think has good fundamental and technical merit; it is a "long energy/short consumer discretionary shares" trade. Recently, we have begun to put this trade on in various ways; and one that we intend on adding to as it becomes more profitable. From a technical perspective, we use the S&P Energy and S&P Consumer Discretionary ratio (XLE/XLY) as our guide. As we look at the chart, we note that over the course of the past year, the ratio has been in a steady if not relentless decline. However, this decline has taken the ratio from overbought levels to oversold levels, and more importantly...into several major long-term support levels. We believe those support levels will hold; and obviously turn the ratio higher. Hence, one is to be long XLE and short XLY. We also have the trade on using long positions in Weatherford Int'l (WFT) and Peabody Energy (BTU); whilst being short Ryland Homes (RYL) and CarMax (KMX). As time moves forward and the trade becomes more engrained, we intend on fine-tuning the trade via swapping out these stocks for those that have greater potential; we want the most out the trade, for it is one that the "hedge and mutual funds" have taken the other side of. The rush to the exit will be quick; it will be fierce...and we will add to the trade as it occurs.
