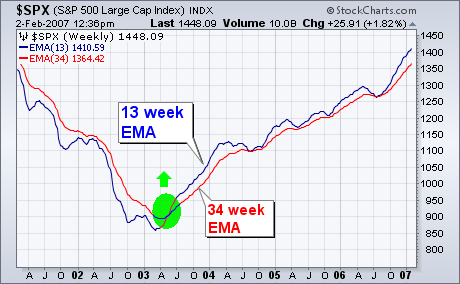
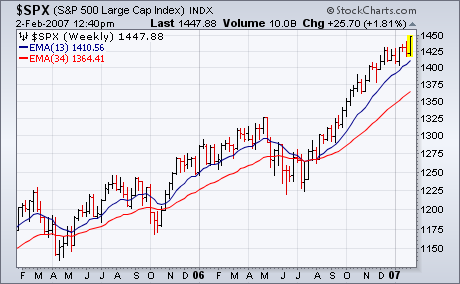
Last July, I reviewed a moving average technique that used weekly exponential moving averages. [I first described this system in October 2005]. I'm revisiting it today because it continues to do remarkably well. And I'd like to suggest expanding its usefulness. The technique is a moving average crossover system. In other words, trading signals are given when the shorter m.a. line crosses the longer. The two moving averages are the 13 and 34 week exponential moving avarages (EMAs). [EMAs are more sensitive than simple moving averages because they give greater weight to more recent price data]. Chart 1 shows the two lines over the last six years for the S&P 500 (absent the price action). Only one crossing (signal) has taken place in those six years. That was a bullish crossing in the spring of 2003 just as the new bull market in stocks was beginning (green circle). Although the two lines converged four times during the four year bull market, the 13 week EMA has never crossed below the 34 EMA. Chart 2 overlays the weekly S&P 500 bars on the two EMA lines for the last two years. The S&P dipped below both lines during the last three market corrections. That doesn't matter. What does matter is that the two moving average lines didn't cross.
The S&P Small-Cap iShares (IJR) hit a new all time high this week and led the market higher over the last six days. Just a few weeks ago, this group was lagging and relative weakness hung over the market The ETF broke above its December high and this is a vote of confidence for both small-caps and the market as a whole.
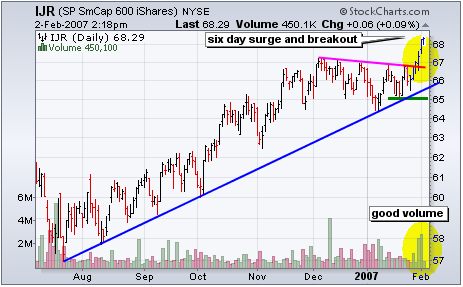
Unfortunately, this vote of confidence from small-caps is overshadowed by a no-confidence vote from techs. Like small-caps, tech stocks typically have higher betas, higher volatility and higher risk. Investors are risk loving when these two groups lead and risk averse when these groups lag. Small-caps are doing their part with a breakout and new highs, but techs are not keeping up and investors are getting choosy.
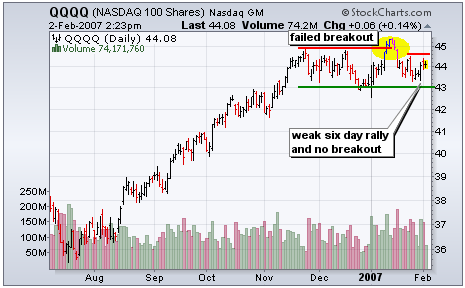
The Nasdaq 100 ETF (QQQQ) broke resistance on 11-January, but failed to hold this breakout and moved right back into the December trading range. The broader non-tech portion of the market rallied this week with the S&P Small-Cap iShares (IJR), the Dow Diamonds (DIA) and the S&P 500 ETF (SPY) hitting 52-week highs. In contrast, QQQQ could not even break above last week's high at 44.47. This no-confidence vote casts a shadow over the broader bull market and I will be watching key support at 43 quite closely.
Timer Digest has ranked Decision Point #1 Bond Timer for the 52-week period ending 1/26/2007. We were also ranked #3 Bond Timer for the year 2006, and #5 Bond Timer for the last five years. Since past performance does not guarantee future results, this information is not particularly useful, except to highlight that we have done something right in the last year or so. Perhaps it would be more accurate to say that the market has favored our methodology, because sometimes it does not. Rather than focusing on the capture of the elusive prize, I thought it would be useful to describe the methodology we are using.
Nearly two years ago I stopped making discretionary calls for bonds (my best guess for market direction), and decided to use a mechanical model that I call the Trend Model, so named because it is driven strictly by trend-following tools, and relies only on the movement of the price index to generate decisions.
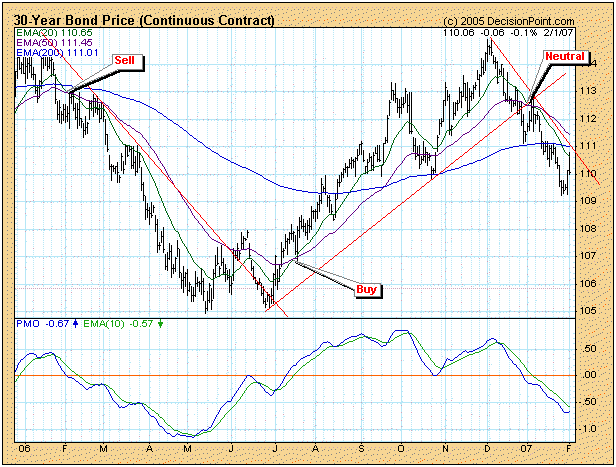
The model uses crossovers of the 20-, 50-, and 200-EMAs (exponential moving averages) of price to generate buy, sell, and neutral signals. The relationship of the 50-EMA to the 200-EMA determines if the price index is in a long-term bull or bear market. For example, it the 50-EMA is above the 200-EMA, it is a bull market.
Crossovers of the 20-EMA and 50-EMA actually generate the signals. If the 20-EMA crosses up through the 50-EMA, a buy signal is generated. When the 20-EMA crosses down through the 50-EMA a sell signal is generated if the 50-EMA is below the 200-EMA, otherwise the model switches to neutral. This is an important feature, because we don't want to be short in a bull market.
The chart below shows important signals generated in the last year. As you can see, the Trend Model is an effective decision-making tool under favorable market conditions.
Then there are unfavorable market conditions. On the next chart we can see how the model gets chopped up when a price index decides to move sideways for an extended period of time. On a positive note, it is also clear why the model goes neutral instead of short during a bull market.
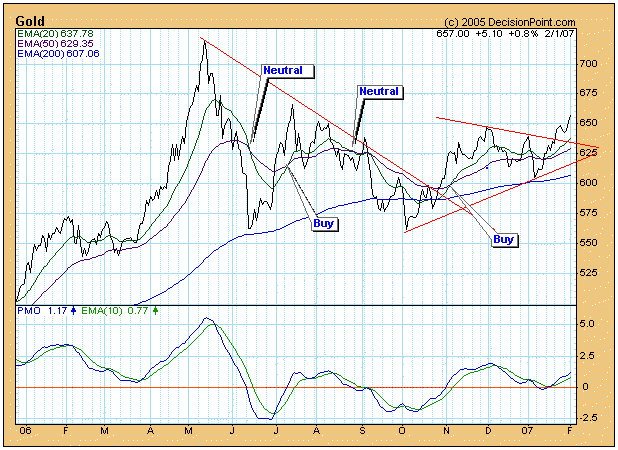
Bottom Line: Trend-following models can be very effective when prices move in one direction for extended periods, but whipsaw is always a problem. This is why money management is important. It is also important to apply a timing model across a broad range of price indexes with different price behavior (multiformity), rather than put all your money in a single index/position.
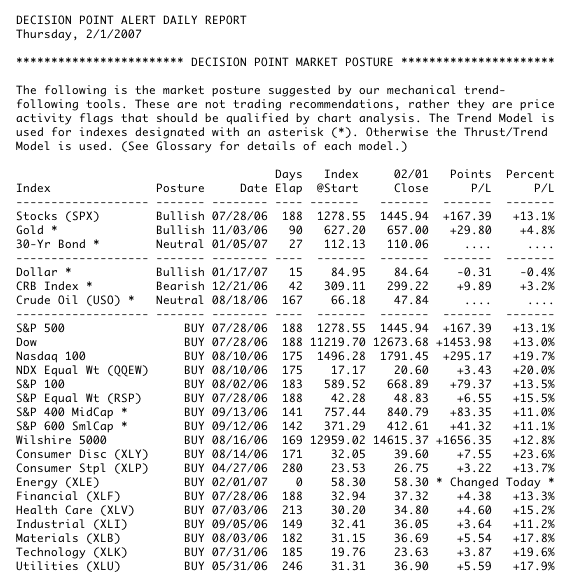
Below is a recent snapshot of our primary timing model status. The indexes marked with an asterisk (*) have signals generated by the Trend Model.
Money generally rotates from one sector to another. Identifying the rotation early in the cycle can make a big difference in trading successfully. If you look at a long-term chart of the Dow Jones Transportation Index (below), you'll see that the group has been trending higher for several years. However, there have been periods when money has rotated out of the group as transports consolidated prior gains. In the past week, we have seen transportation issues rise to the front of the pack. This past week saw transports finish at an all-time high close. Volume was accelerating during this rise, indicative of accumulation. Outside of temporary pullbacks, expect continued strength in this group until proven otherwise.
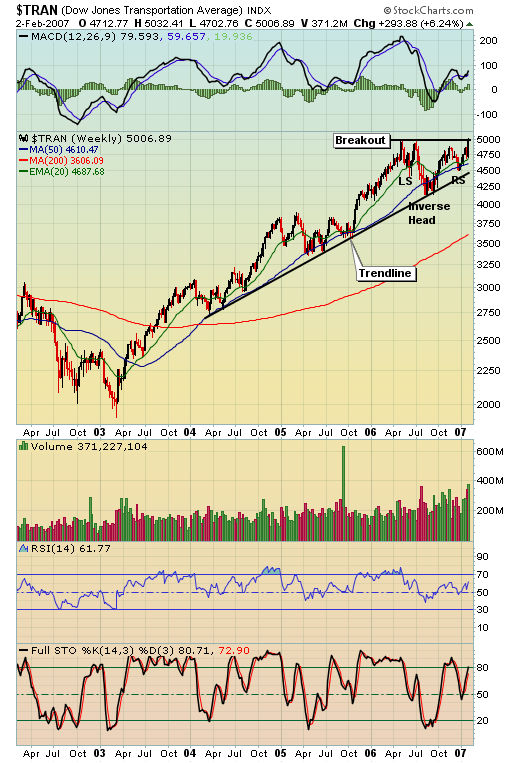
Notice the inverse head and shoulders pattern that has formed over the past nine months or so. This represents a continuation pattern that upon breakout measures to 5900 in time. Continue to look for solid trading ideas in this group and you'll likely be rewarded during 2007.
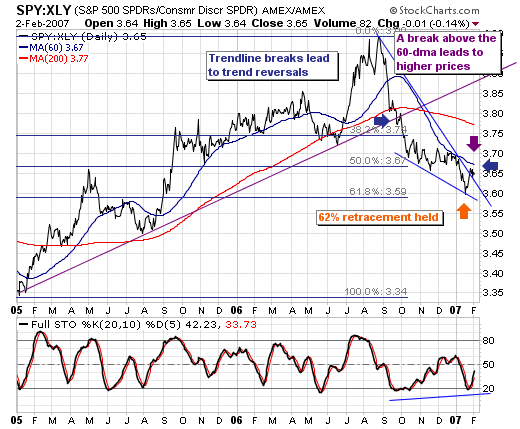
From our vantage point; the S&P 500 SPDR (SPY) is poised to outperform the Consumer Discrectionary SPDR (XLY) in all-time frames (short-intermediate-long), with a new highs expected to be reached in the late-2007 to 2008 time frame. Our reasoning is such:
Secondly, a bullish declining wedge is confirmed, of which steep trendline resistance was broken. Prices are consolidating short-term, but given the postive 20-day stochastic divergence...the path of least resistance is higher.
Thirdly, if the 60-day moving average is broken, then we would expect to see mean reversion in the least to the 200-day moving average. This will be next "large fulcrum point" upon which we can either confirm or deny our thesis of new highs dependent upon whether prices breakout above this level or not.
And lastly, even if we are wrong in our long-term assessment and prices are headed lower, we shall have ample time and an optimal entry point as prices "fail" to brekaout above the 200-day moving average level.
How to trade: One can either buy SPY and sell short XLY in equal dollar amounts; or, one can focus in upon shorting the consumer discretionary stocks given the general SPY overbought conditions. We are focusing in upon shorting the consumer discretionary stocks; and in particular...are looking for a high in the homebuilders after they have retraced quite some distances of their declines. Also, we have put on a "long energy/short consumer discretionary" trade that is proving to be quite profitable.