| |
|
|
|
|
| |

|
ChartWatchers
the StockCharts.com Newsletter
|
|
|
|
|
|
|
|
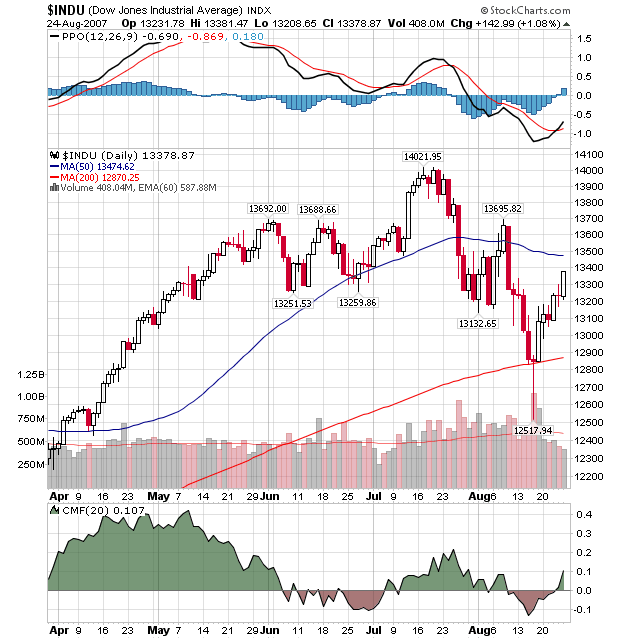
Last week, some significant positive technical developments occurred on our GalleryView chart of the Dow:

After recovering to remain above the 200-day moving the previous week (see the red candle whose shadow dipped all the way to 12,517?), the Dow has rebounded nicely with a nice string of tall white candles. Those candles have managed to turn around the MACD and push the MACD Histogram back into positive territory. In addition, the Chaiken Money Flow (CMF) has also returned to the green side of the ledger.
So is it safe to jump back into the market right now? Well... There is one really big negative on the chart too. Can you spot it? If not, don't worry - John Murphy talks about it in detail below.
The declining market volume that accompanies this rise in prices should give everyone pause. As the Dow closes in on it's 50-day moving average (blue line), expect it to reverse lower unless buying volume increases significantly.
WHERE'S THE VOLUME?by John Murphy | The Market Message EXPECTING SHORT-TERM TOPby Carl Swenlin | DecisionPoint.com
In my August 17 article, Looking For A Retest, I speculated that we would get a bounce from the extreme price lows hit in mid-August, but that a retest of those lows needed to occur before we could be reasonably certain that the completion of a solid bottom had been accomplished. As it happened, the bounce was initiated before I posted the article. At this point I think the evidence suggests that the reaction rally has just about run its course, and that we should be expecting a price top to mark the beginning of a decline into the retest of recent lows.
The evidence of which I speak can be seen on the chart below (and on many other short-term indicator charts). There are two versions of the Swenlin Trading Oscillator (STO) â one is calculated from advance-decline breadth (STO-B) and the other from volume (STO-V). On the chart I have outlined two corrective phases â the February/March correction, and the current correction, which, in my opinion, is not yet complete.

Note that there were three separate down thrusts in February/March. The first was into the initial price low, which also registered the lowest of the STO readings. The second was the retest of the first price low, which registered a slightly lower price accompanied by higher STO readings. The third move down was a pullback after a breakout. Note that the breakout was accompanied by very high STO readings, indicating an initial impulse for a new rally, and after that third pullback, the price configuration was clearly bullish.
The current correction has a more bearish slant. The price decline has been more violent, and the second down thrust has led to a much lower price low. The market has rallied out of that low, but you can see that the STO has reached overbought territory, and we should be expecting a short-term top leading to a retest of the correction low. There is no guarantee that the support will hold, so it is no time to be trying to pick a bottom.
Bottom Line: Good arguments are being made by both the bulls and the bears, and the possibilities being presented range from the market being up 22% a year from now to the danger of a 2000 point down day on the Dow. Rather than trying to decide which scenario might materialize, I am comforted by that fact that we are currently 100% neutral in the event the bottom falls out, and I am confident that our primary timing model will pull us into the market in time to catch a good part of any significant up move that occurs.
EXTREME PESSIMISM MARKS BOTTOMby Tom Bowley | InvestEd Central
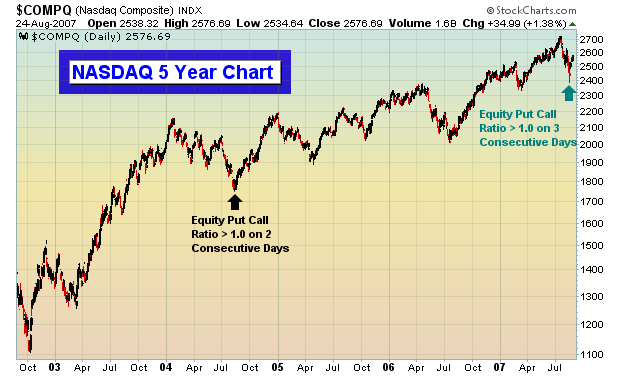
We've discussed in the past the tendency of the market to put in long-term bottoms when the bearish sentiment reaches extreme levels. Extreme bearishness is exactly what we saw on Thursday, August 16. Over the past 4 years or so, we've experienced many occasions when the put call ratio has exceeded 1.0. But there have only been a dozen or so times that the "equity only" put call ratio has topped 1.0. Prior to the recent downtrend, when had seen only one previous occasion where that "equity only" put call ratio topped 1.0 on consecutive days. That occurred in mid-August 2004. On the chart below, you can clearly see that the extreme pessimism seen then marked a long-term bottom, one that was never retested.

Many market pundits are suggesting that we're headed towards disaster given the recent credit crunch. Even that nasty "recession" word is being tossed about. We don't believe a word of it. We look at the current market conditions as a major buying opportunity. Our only question is whether the market can sustain its recent rally as we head into the worst calendar month of the year - September. Major market tops normally coincide with excess bullish sentiment. For instance in 2000 when the major indices began its downward spiral, it was routine to see put call ratios down around .40-.50 - very bullish indeed. Everyone was buying calls because it was "easy money." Margin debt used to buy stocks was at outrageous levels and when the selling began, it fed off itself - a domino effect if you will. We are looking at a market at the opposite end of the sentiment spectrum now. Instead of record margin debt to finance stocks, we see record short interest. Instead of bullish call buyers, we have bearish put buyers. The masses in the options world rarely get it right.
When the Fed begins its interest rate cutting campaign - and the only argument in our minds is when, not if - the stock market will snap back like a stretched rubber band. We've only seen the beginning in the last week. We maintain our very bullish stance on the market with a bias towards the large cap NASDAQ 100 index.
WHERE ARE WE IN THE CYCLE?by Richard Rhodes | The Rhodes Report
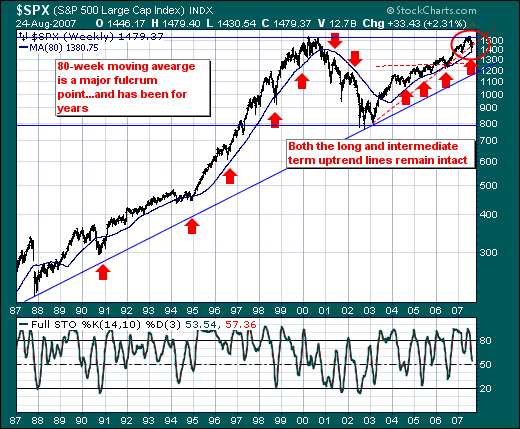
Given the volatility of the capital markets these past two weeks, we think it instructive to step back and take a longer-term viewpoint of the stock market to discern where we may be in the cycle. In doing so, we find the S&P 500 large caps - the strongest relative US average given its international exposure - trading well above its longer-term trendline as well as its 80-week moving average. In the past, this moving average has provided "fulcrum points" between bearish corrections in a bull market and outright bear markets. In the present case, this moving average was successfully tested seven trading sessions prior at 1378, and closed this week out at 1479... a full 100 points above it. Perhaps this simply indicates that a normal -10% correction within a bull market has occurred, and prices have now resumed their upward trend.

That said, the credit contagion seems to be contained for time being; however, the character of the rally hasn't been "strong enough" for us to believe that a "lift-off bottom" is in place. Thus, we are now in the process of layering on short positions for the seasonal September-November swoon back into the 80-week moving average is forthcoming. And if broken - then we would expect to see a bear market decline of -20% and perhaps even more.
As they say: Timing everything.
|
|
|
|
|
|
|
|
|
|
|
|
|
|
|