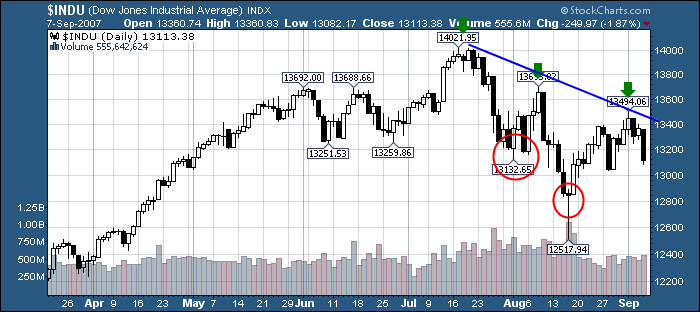
"The trend is your friend" or, in this case, the market's enemy. You may have noticed lots of vacillating in the traditional financial press this past week - gloom and doom after the market closes lower, supreme optimism the very next day when the market moves higher. ChartWatchers shouldn't be fooled by the media's need to generate market opinions that sell papers. The market's trend has been clear for weeks and despite what the optimists say, that trend is down. The Dow chart shows it clearly with three lower peaks separated by two lower troughs. Last week's third peak is the "final nail in the coffin" - confirming the downtrend beyond a shadow of a doubt. Don't fight a clear trend folks. Until a clear up-trend is re-established (see this article for details), the default expectation for stocks should be that they will move lower.
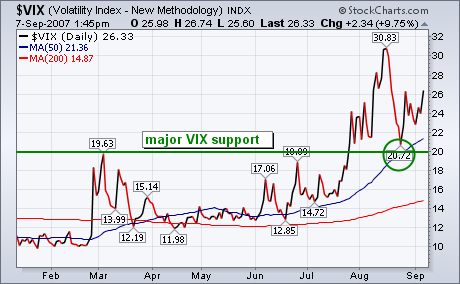
Earlier in the week I heard a TV commentator (masquerading as an analyst) give his interpretation of the CBOE Volatility (VIX) Index. His conclusion of course was bullish. He correctly pointed out that peaks in the VIX usually coincide with market bottoms. He then bullishly concluded that since the VIX peaked in mid-August, the market had bottomed. The problem with that bullish interpretation is that the major trend of the VIX is still up. Recently, I wrote that the VIX would probably find major support near the 20 level before turning back up again. I got the 20 support number from two sources. One was the 50-day moving average. The other was the March peak. Pullbacks in an uptrend should always find support near a previous peak. If the VIX is turning back up (as it seems to be doing), that would signal the end of the market rally and not the start of a new uptrend. Here again, when you hear TV people doing their version of technical analysis, turn off the sound and look at your chart.
The Finance SPDR (XLF) and Consumer Discretionary SPDR (XLY) formed large double tops this year, and both broke support in late July to confirm these bearish reversal patterns. Volatile trading ranges followed these support breaks (yellow ovals), but these ranges look like consolidations after a sharp decline. In other words, XLY and XLF became oversold in mid August, and these consolidations worked off these oversold conditions. Friday's sharp decline looks like the start of another move lower, and a move to the next support area is expected.
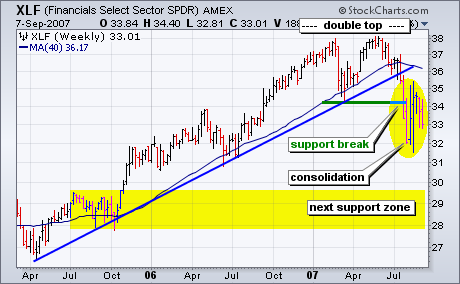
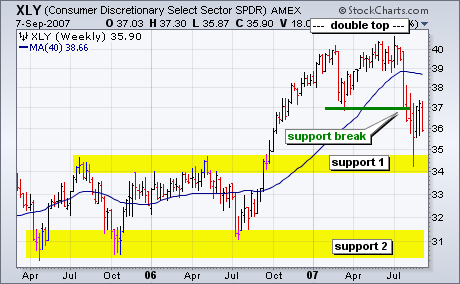
Both sectors are important to the overall market. The Finance sector represents banks, brokers and REITs. It is the single biggest sector in the S&P 500. Moreover, banks and brokers are at the heart of the sub-prime problems, and this issue is not going away until the Finance sector rebounds. The Consumer Discretionary sector consists of retailers, restaurants, media companies and automakers. It is the most economically sensitive sector, and a breakdown in XLY bodes ill for the economy overall.
It is well known that October is the cruelest month on average, but sometimes September beats October to the punch. This may be one of those times. Looking at the chart below we can see that the market has bounced out of the August lows and has formed two short-term tops, the last being higher than the first. Corresponding with those rising tops are two sets of declining tops on the two short-term technical indicators. This is known as a negative divergence, and it is a short-term bearish sign that probably is announcing an impending retest of the August lows.
The fact that we are looking for this retest in September, a sometimes cruel month, could mean that the retest will be more scary than most people are expecting. I would not rule out a failed retest that sees prices fall past the August lows and plunges us into a bear market. This is not a prediction, just a possible scenario that ought to be considered.
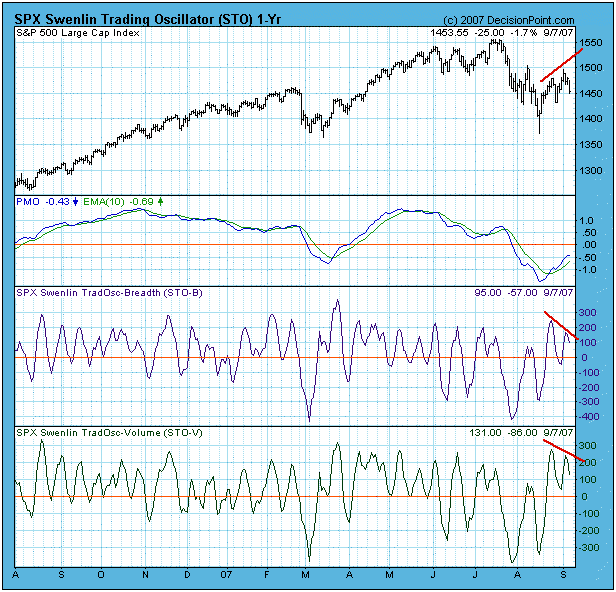
What I really want to see is a successful retest and a resumption of the bull market, but, as we all know, "you don't always get what you want." For one thing the bearish outcome discussed above could be the ultimate outcome, but it could break the other way as well. By that I mean that we may not get the retest that would put our minds at ease and prepare us mentally for the next big rally. Instead the market could already be in the beginning of the next big rally.
Bottom Line: The odds favor a retest, and that decline could turn nasty in a hurry. Unless we see more buy signals on the major market indexes, I will be staying out of the market until the retest (or whatever) is complete.
Regardless of my personal opinion, we rely on the mechanical trend models to determine our market posture. Below is a recent snapshot of our primary trend-following timing model status for the major indexes and sectors we track. Note that we have added the nine Rydex Equal Weight ETF versions of the S&P Spider Sectors. This may seem redundant, but the equal weighted indexes most often do not perform the same as their cap-weighted counterparts, and they provide a way to diversify exposure.

Technical analysis is a windsock, not a crystal ball. Be prepared to adjust your tactics and strategy if conditions change.
The jobs report sent a jolt to the stock market on Friday. We believe it'll be a temporary jolt, but a jolt nonetheless. That data gave the Fed all the ammunition it needs to do what the market has been expecting for weeks - to cut the fed funds rate. The question has now become, will it be 25 or 50 basis points? For the U.S. Dollar Index, it won't matter. The lowering of interest rates here in the U.S. will turn a weak dollar into an even weaker one. Take a look at the monthly chart (Chart 1) of the U.S. Dollar Index over the past 27 years and compare the movement in the dollar to the movement in gold prices (Chart 2) over that same span.
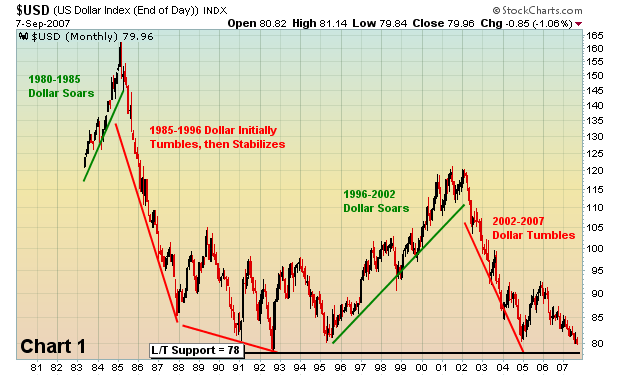
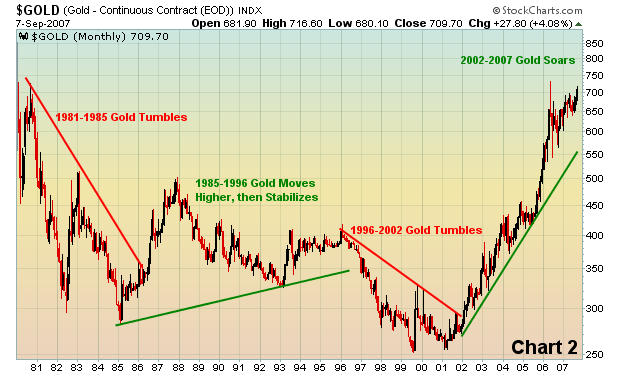
Clearly, there is an inverse relationship between the dollar and gold that has weathered many economic cycles. So here's the question we need to answer. If the Fed is on the verge of beginning an interest rate reduction campaign, will the dollar continue to weaken? We believe it will, which in turn should lead to a continuing bull market in gold, at least in the short-term say over the next 3-6 months. Then we'll re-evaluate.
We have maintained a very bullish theme on equities in general and once we clear the historically bearish month of September, we expect the bullish long-term trend to resume. In an environment of a weak dollar, we especially like the large cap multi-national stocks found on the NASDAQ 100 where earnings can be expected to rise significantly. We continue to favor the technology sector.
Although last week's broader market was under pressure, the long forgotten Biotech HOLDRs (BBH) showed surprising resilience, and, in fact, is on the cusp of a major breakout. If you'll recall, BBH has underperformed badly in the past, even while posting very good earnings. That puts BBH in the categories of "value" and "defensive," code words used to describe a security in which money will flow in a market decline. Thus, we can make a fundamental and technical case to be buyers.
From a technical perspective, BBH has a history of rising very sharply, then consolidating prices for a year or two. This current consolidation began in early-2005 â making it nearly 2 ½ years old. Classical technical analysis tells us that the longer the base â the more sustained the move. Thus far, previous support has held at $158, which is just above the rising 200-week moving average. Too, prices are hard upon the 80-week moving average at $171 â a level we think will be handily broken in the days and weeks ahead, given the 14-week Stochastic is turning higher from oversold levels. 
Therefore, the technical setup is rather good. It really doesn't get much better than this as they say. Our target on the trade is above $220.