I realize that the long-term ChartWatchers out there already know how important our specials are, but I wanted to take a moment to mention it to our newer members. One thing that has never changed at StockCharts.com is our pricing. We have had the exact same price for our subscriptions since we launched them way back at the start of 2002. How many other things in this world have not increased in price since 2002? I can't think of many things in that category. And, during the month of October, our prices have actually decreased.
Right now, if you order a 6 month subscription, you will get 7 months. If you order a 12 month subscription, you'll get 14 months. The offer runs from now until the end of October. After that, we go back to our standard pricing.
The offer applies to any kind of subscription we offer - Basic, Extra, ExtraRT, John Murphy's Market Message and our Combination subscriptions. The offer applies to new subscribers as well as existing subscribers. If you are already a StockCharts.com member and your subscription will expire within the next 12 months, you should consider renewing NOW instead of waiting - you'll lock in with our special pricing instead of risking renewal at a time when we are not offering this deal.
To renew or to join at our Fall Special rates, click here then click on the "Sign Up Now" button on the left side of the page.
"But wait, that's not all..." - Anonymous TV Salesman
So, we wanted to do something more "special-er" for this year's special. Giving our users free time is great, but what else could we do to help everyone? Our solution is to offer Free Shipping on All Book Store purchases! This is something we almost never offer, and usually we have to restrict this kind of offer to US addresses only. This year, because of the high cost of international shipping, we still have to limit the offer - but this year, for the first time ever, we are offering free shipping to both US and Canadian addresses.
The free shipping offer couldn't come at a better time. There are some really great new books in the store. Here's a link to all of the new books we have. And here's a link to one of my new favorites: Technical Analysis: The Complete Resource for Financial Market Technicians. This is a great book for people just getting into Technical Analysis. It covers many of the newer developments in the field such as the lessons learned from the demise of Enron and the failure of LTFM. It can even be used as a resource for earning your CMT! I highly recommend it.
Any way, sorry for the sales pitch, but these are some truly special deals - the best we'll be able to offer for quite some time. I wanted to be sure everyone was aware of them.
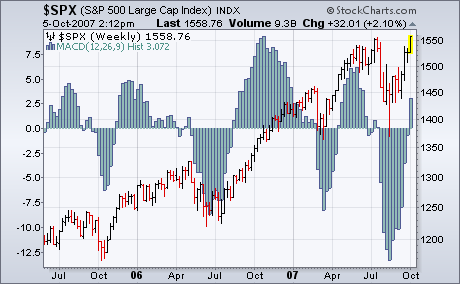
Last Friday, I wrote that the weekly MACD lines hadn't turned positive yet for the S&P 500, but were close to doing so. They turned positive this week. I wrote last Friday that "we need to see a positive crossing by the weekly (MACD) lines (or a histogram move over zero) to confirm that the current rally has enough strength to move to new highs". Both events took place this week. The chart below plots the weekly MACD histogram bars on top of the S&P 500. Intermediate buy and sell signals are given when the histogram bars move above and below the zero line. Since this is weekly indicator, its signal are given much later than signals on daily charts (which turned positive during August). But it's an important confirmation that the current rally has some staying power. It's taken seven weeks from the histogram bottom in mid-August to a bullish crossing. That's not unusual. It took eight weeks for that to happen in the summer of 2006. What is unusual this time is that the bullish crossover took place as the market was hitting a new high. Most often, the weekly MACD lines turn up well before a new high. The reason for this late crossing is the unusually deep correction this summer. The histogram bars fell to the lowest level in four years. That's why it took it so long to turn positive. It's a late signal, but an encouraging one.
Before looking at the chart for the Dow Transports, let's look at the Dow Theory situation. The Dow Industrials and Dow Transports both hit new highs in July and this marked a Dow Theory confirmation (bullish). Despite this bull market confirmation, both dropped sharply from mid July to mid August. In fact, both broke below their June lows and this development was bearish. The Dow Industrials quickly rectified this support break with a surge to new highs, but the Dow Transports could not get lift off and remained below its August-September highs. The Dow Transports has yet to confirm the new high in the Dow Industrials and this amounts to a Dow Theory non-confirmation.


Turning to the price chart for the Dow Transports, you can see that this key average broke above the August-September highs with a big surge on Friday. This breakout is significant because the Transports were showing relative weakness. The breakout is the first step to challenging the July high and confirming the Dow Industrials. At this point, the trend is up for the Dow Transports and I expect a move towards 5300-5500 as long as key support at 4800 holds.
The market has had a good run since the August lows, but it is challenging all-time highs, and the technical support has been somewhat anemic. With many indicators reaching into overbought territory, and overhead resistance becoming an issue, it looks like a good time for a pullback or consolidation to digest recent gains.
As for technical weakness, the first thing that strikes me is the failure of volume to confirm recent price gains. Note on our first chart that most of the volume bars supporting the recent rally are well below the moving average line.

The next chart shows the failure of new 52-week highs to confirm new price highs, and we can observe an uncomfortable level of expanding new lows that accompanied minor pullbacks during the rally.

Finally, we have the Rel-to-52 chart, one of our more unusual indicators. The Relative to 52-Week Hi/Lo (Rel to 52) chart tracks each stock in a given market index and determines the location of its current price in relation to the 52-week high and 52-week low. We express this relationship using a scale of zero (at the 52-week low) to 100 (at the 52-week high). A stock in the middle of its 52-week range would get a "Rel-to-52" value of 50.
This chart shows the average "Rel-to-52" value for all the stocks in the S&P 500 Index. Not only is there a negative divergence between the indicator and the price index, but the indicator value is only 60. So while the Rel-to-52 value for the S&P 500 is 100 (it is making new 52-week price highs), the indicator value of 60 shows that the number of stocks participating in making the new price highs is unusually low, probably indicating that prices are being supported by larger-cap stocks.

Bottom Line: While the market is making new highs, technical support is fading and a corrective pullback should be expected within the next week or so.
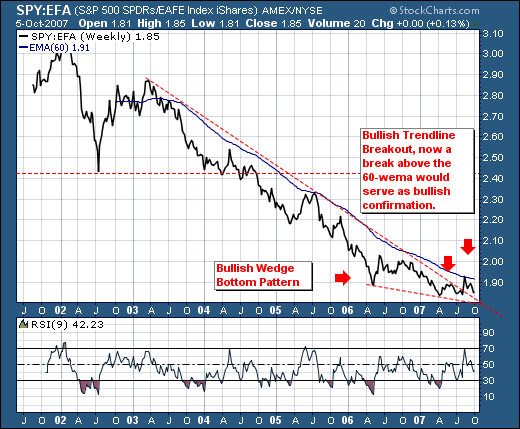
Last week, both the Dow Industrials and the S&P 500 broke out to new highs last week in show of modest strength; but what we find more interesting that this circumstance... is that the foreign markets aren't outperforming the US large caps. One only need understand that TV commentators; Wall Street strategists and the trading public is enamored with foreign market exposure , whether it be developed markets - or even emerging markets. A majority of incremental funds allocated to US mutual funds have gone towards international funds. This love affair with all things "international" is quite likely coming to a close.
We'll simply show the ratio of the S&P 500 large caps (SPY) versus the Morgan Stanley EAFE Index (EFA), which tracks only international stocks. While money has poured into this sector, we find that since April 2006 - the out-performance has been minimal - especially given all the "hoopla." Too, we find the ratio has formed a bullish wedge bottom, with prices trading right below their 60-week exponential moving average. If prices breakout above this level - then this event would serve as confirmation to us that a multi-year period of international underperformance is ahead.
When you hear TV commentators or Wall Street strategists opine that the US is decoupling from international stocks; don't think again - they're right - but they are wrong given the US is very likely to outperform international stocks. This clearly will catch everyone offsides; which typically happens at major trading inflection points. Attention is to be paid.