| |
|
|
|
|
| |

|
ChartWatchers
the StockCharts.com Newsletter
|
|
|
|
|
|
|
|
"BEARISH" PERCENT INDEXESby Chip Anderson | ChartWatchers
Lots of people are doing the Chicken Little thing these days. Is the concern/panic justified? Are we really entering a new Bear market? Which charts are going to calmly and objectively tell us what is really going on?
Whenever I want to study "the big picture" and see if anything really significant has changed, I usually turn to the "Bullish Percent" charts that we maintain here at StockCharts.com. For those of you that haven't heard of them before, a "Bullish Percent" chart plots the percentage of stocks in a predefined group that currently have a "P&F Buy Signal" on their Point and Figure chart. You can read more about Bullish Percent charts here.
Usually, Bullish Percent Indices oscillate lazily somewhere between 30 and 70. Because they are the result of studying thousands of charts, the BPI's for the Nasdaq Composite and the NYSE usually move pretty slowly and it takes them a little bit of time (at least a week) to reflect a significant change in the market. While they may be too slow for day-traders, that slowness makes them very reliable for the rest of us.
So, with all this talk of a Bear market, what do the BPI's say? Here are the charts:
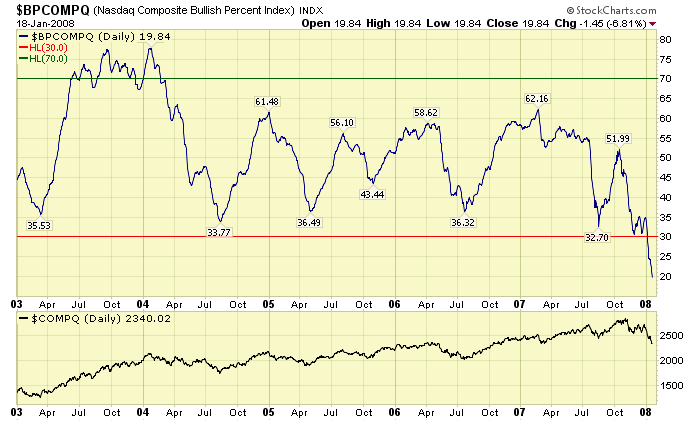
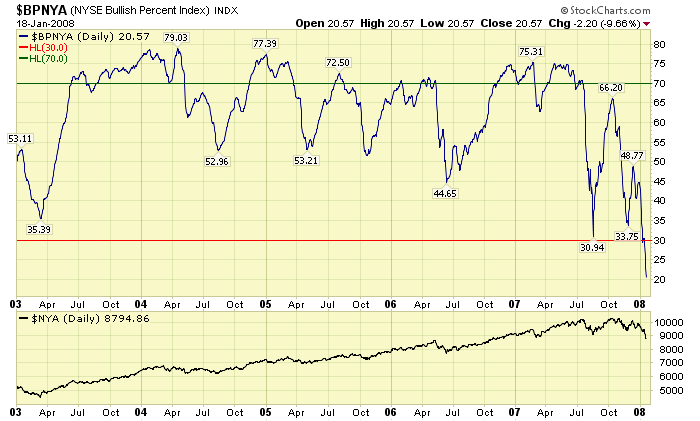
Well... I think the word "Yikes!" might actually apply here. Both the Nasdaq and NYSE BPIs are now lower than they have been since the start of the Bull Market in 2003. That should give any ChartWatcher pause. Remember, readings below 30 indicate a change in the market and right now these charts have reading at or below 20.
Usually, the BPIs bounce back from super-low readings quickly. If that happens in the coming weeks, don't be fooled. Continue to watch them closely because a second plunge below 30 after a recovery would be confirmation of a Bear Market. Check out this chart of the lead up to the 2001 Bear Market:
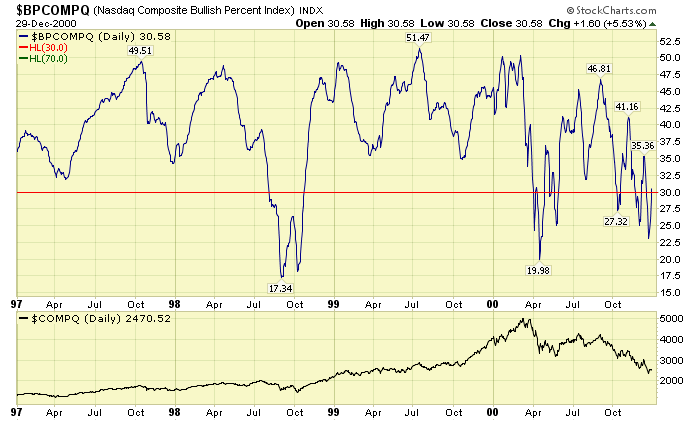
After the first BPI-plunge in mid-1998, things recovered and the Nasdaq soared to record heights. But the second BPI-plunge in 2000 confirmed the end of good times for everyone.
Be careful out there.
SO MUCH FOR GLOBAL DECOUPLINGby John Murphy | The Market Message
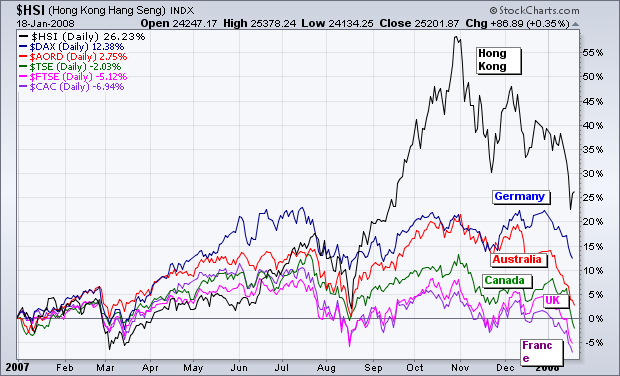
I've expressed reservations before about the recent theory of global decoupling. The reasoning was that foreign markets would remain relatively immune to a major selloff (and possible recession) in the U.S. That view struck me as strange, especially with the close correlation that's existed between global markets over the past decade. Which is why Chart 1 shouldn't come as a surprise to anyone. It shows a sampling of the world's major developed stock markets over the last year. And, not surprisingly, each and every one of them started to fall in November along with the U.S. market. Most haven fallen as far as far as the U.S., but they are falling. The only ones still in the black for the last year are Hong Kong (+26%), Germany (+12%), and Australia (+2%). The biggest yearly losers are France (-7%), Britain (-5%), and Canada (-2%). By comparison, the S&P 500 lost -6.5%.
DOUBLE TOP PARADE CONTINUESby Arthur Hill | Art's Charts
The Materials SPDR (XLB) joined the double top club with a sharp decline this past week. The Finance SPDR (XLF) and Consumer Discretionary SPDR (XLY) started the club with double top support breaks in August. The Russell 2000 ETF (IWM) broke double top support in November. And finally, the S&P 500 ETF (SPY) broke double top support this year. These are not small double tops, but rather large reversal patterns that have been confirmed. Moreover, these are important ETFs and lower lows are clearly bearish.
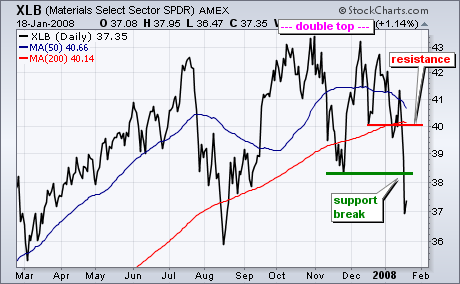
The double top unfolded as XLB met resistance around 43 in October and again in December. The intermittent low formed in November and XLB broke below this low to confirm the pattern. XLB is also trading below its 50-day and 200-day moving averages. Even though the big trend is now down, the ETF is short-term oversold and could bounce. Broken support turns into resistance around 40 and there is also resistance in this area from the two key moving averages. An oversold bounce is possible, but I would expect it to fail around 40. Look back at the XLF and XLY double tops for clues on how this pattern may unfold in the coming weeks and months.
BEAR MARKET RULES APPLYby Carl Swenlin | DecisionPoint.com
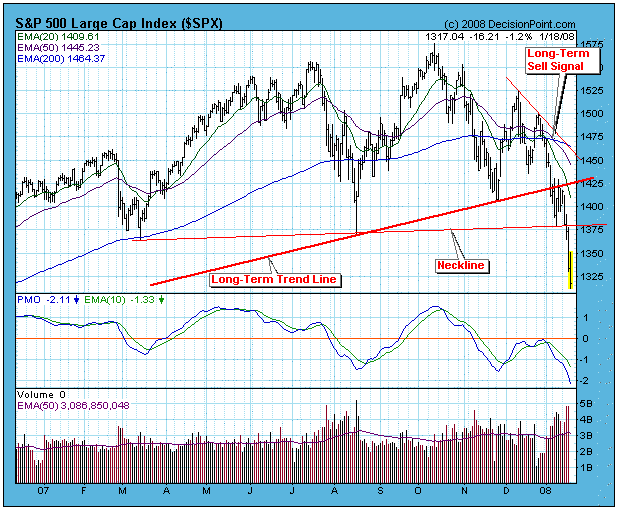
On January 8 the 50-EMA crossed down through the 200-EMA on the S&P 500 daily chart, generating a long-term sell signal and declaring that we are now in a bear market. This was confirmed this week when the weekly 17-EMA crossed down through the 43-EMA. Let me say that these signals are not 100% reliable, but there is a ton of additional supporting evidence, such as the decisive violation of the long-term rising trend line, and the violation of the double top neckline, seen on the chart below.
The next chart presents a long-term view, which makes it more clear how serious the situation is.
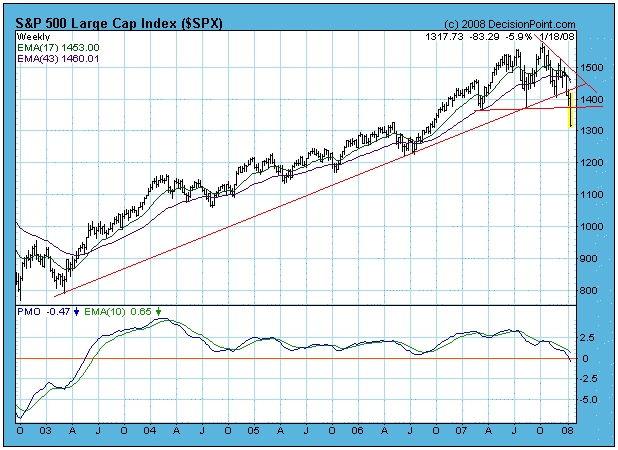
An important point is that this long-term sell signal is not so much an action signal as it is an information signal. What this means is that we need to begin interpreting charts and indicators in the context of a bear market template. For example:
- Oversold conditions should be viewed as extremely dangerous. Whereas in bull markets oversold lows usually present buying opportunities, in bear markets they can often resolve into more heavy selling.
- Overbought conditions in a bear market are most likely to signal that a trading top is at hand.
- While bear market rallies present great profit opportunities, long positions should be managed as short-term only.
The questions remain as to how far down prices will go and how long the bear market will last? In the shorter term we have a minimum downside projection from the double top neckline of about 1160 on the S&P 500 Index. That could mark a medium-term low from which a bear market rally could rise. For the longer-term, let's look at the 4-Year Cycle chart below. As you can see, the last cycle low was in mid-2006, so the next projected low is in mid-2010. Assuming that the cycle low and bear market low will be the same, we have a long, bloody road ahead. The most obvious downside target is the support at the 2002 lows, about 750 on the S&P 500.
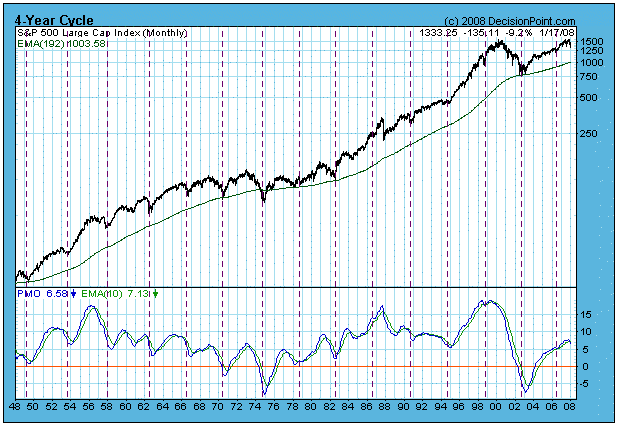
I think the basis for my conclusions is fairly easy to see and understand, but please keep in mind that these are educated guesses â somewhat better than wild guesses â and they are subject to radical revisions as reality unfolds. If it actually turns out that way, no one will be more surprised than I.
Bottom Line: Probability is very high that the bull market top arrived in October 2007 and that we are now in a bear market that will continue for another year or more, possibly until mid-2010. Until we have evidence to the contrary, remember that bear market rules apply. The next thing to expect is a reaction rally back toward the recently violated neckline support, which is now overhead resistence.
IS IT BEAR SEASON?by Tom Bowley | InvestEd Central
The two most frequently asked questions these days are as follows: (1) Are we in a bear market? (2) Where's the bottom?
Let's take them one at a time. A bear market is generally defined as a decline of 20% or more. At the close on Friday, the declines across the major indices from their recent highs are:
Dow Jones: -2181 pts, or -15.27%
S&P 500: -251 pts, or -15.93%
NASDAQ: -521 pts, or -18.21%
NASDAQ 100: -395 pts, or -17.64%
Russell 2000: -183 pts, or -21.38%
The Russell 2000 is already in a bear market and the other indices are closing in on it. We believe it's going to be close as to whether all the indices actually hit that 20% decline. Pessimism has been ramping up in the last 2 or 3 trading days and extreme pessimism marks significant intermediate-term or long-term bottoms nearly every time.
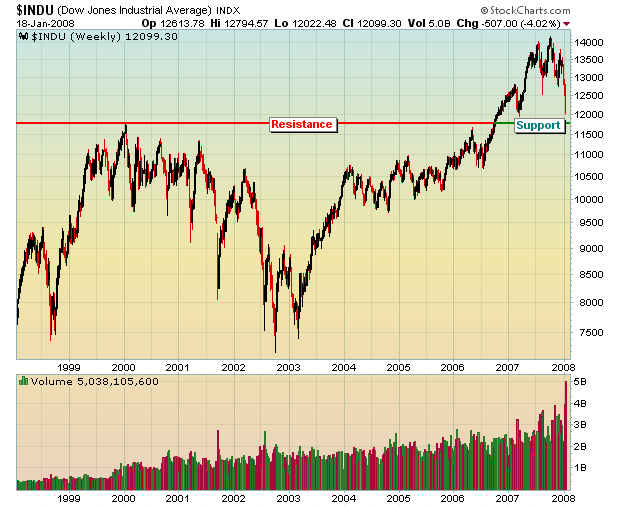
Now let's tackle that second question - how low might we go? First, look at the 10 year weekly chart on the Dow. There was a long-term double top at 11,700 that finally gave way in the second half of 2006, as can be seen below:
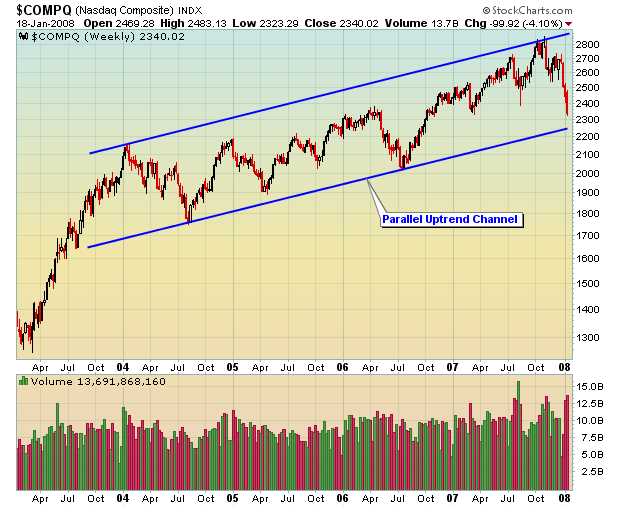
On the NASDAQ, we're watching a long-term parallel uptrend channel that's been in place for over 4 years. If that channel is broken, then more downside is entirely possible. Below is a look at that long-term channel:
Perhaps the most important factor in the market right now is the increase in pessimism as reflected by the spike in the VIX at the end of last week and the increase in the put call ratio. In both March and August of last year, bottoms occurred as the 5 day moving average of the put call ratio moved above 1.30. That signaled extreme bearishness in the options world and the market bottomed as the put call ratio is a contrarian indicator. In November 2007 and again in early January, the market was dropping, but fear was not hitting panic levels. That has begun to change and will be a very important indicator to watch as the next week unfolds. In the chart below, you can clearly see the spiking 5 day moving average as significant bottoms were reached in March and August of 2007 (red circles):
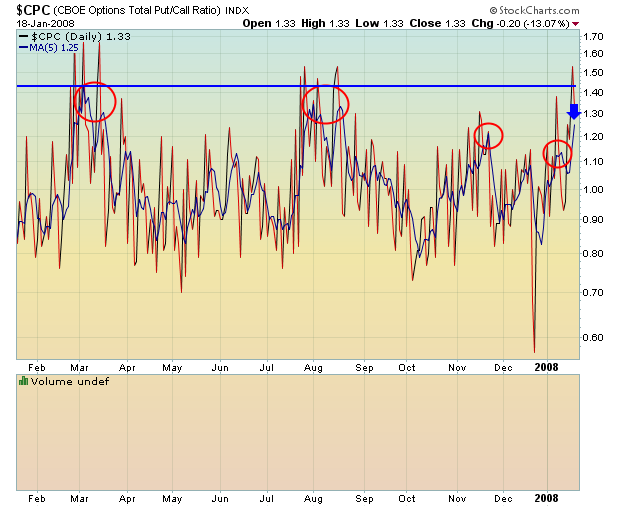
From the blue arrow at the right hand side of the chart, you can see that fear is ramping up considerably with last week's selling. Continuation of that trend will increase the odds of a significant bottoming process.
Happy Trading!
BULL MARKET IS OVERby Richard Rhodes | The Rhodes Report
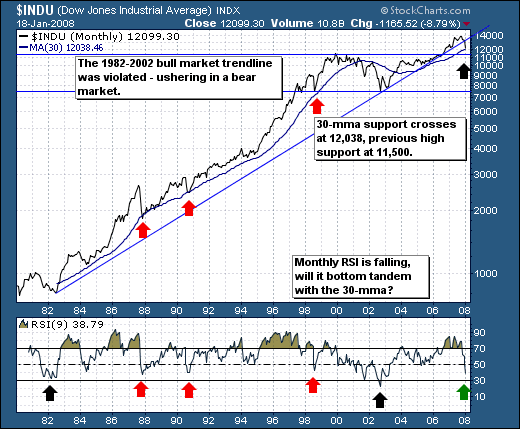
The bull market is over; the Dow Industrials broke below its major bull market trendline extending from the 1982 bear market lows through the 2002 bear market lows. Obviously, one cannot take this lightly, as last week's negative price action was more of a bear market "exclamation point" intended to say that from this point forward - rallies are to be sold and sold hard. However, it would appear the initial decline is coming to an end quite soon; the 30-month moving average crosses at 12,038 and was successfully tested on Friday. Too, the previous highs all-time highs at 11,500 are just below current levels. The 9-month RSI is approaching levels that in the past have coincided with bull market correction bottoms and bear market bottoms. Thus, the risk-reward profile for the Dow is changing in the short-term from bearish to 'flat' and will ultimately turn to bullish. But, remembering that the trend is lower... rallies will be short-lived.
But that said, one would do well to consider 'guerrilla bear market tactics' when trading from the long side, of which sector rotation will be paramount. Rallies are likely to be short and sharp; but sold hard. The sectors now showing emerging bullish relative strength patterns versus the S&P 500 in our models are the beleaguered Financials and Consumer Discretionary (Housing and Retail). The Basic Materials and Energy sectors are showing emerging negative patterns. These are non-consensus calls at the moment; but given the former held relatively during last week's carnage, while the latter were aggressively - perhaps these will be the emerging theme trades of 2008.
|
|
|
|
|
|
|
|
|
|
|
|
|
|
|